
Ag Weather Forum
Data From Analog Year 2012 Suggests the Potential for Hot and Dry Weather During the 2025 Crop Season

A look at weather analog years -- benchmarks for data, events and experiences -- for the 2025 crop season by the DTN long-range forecast team has the harsh crop year 2012 as No. 1. That leads to some concern right away about the potential for hot and dry conditions to stress the U.S. corn crop this year.
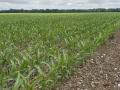
The year 2012 was a tough one. The total U.S. corn crop that year, at just under 11 billion bushels (bb), was 13% below 2011. The average yield in 2012 was pegged at slightly above 123 bushels per acre (bpa). That was almost 24-bpa below the 2011 yield of 147.2 bpa and was the lowest since 1995. The 2012 yield is also the lowest corn yield so far this century. The crop year began with dry and warm conditions which favored rapid planting progress. Following that quick start, however, a hot and dry combination across the central U.S. resulted in withered crops and the subsequent slump in yields.
DTN Senior Weather Risk Communicator Nathan Hamblin noted in 2025, the primary reasons for leaning toward 2012 as the top analog year are drought comparisons and ocean temperatures. "2012 has warm sea surface temperatures near South America and parts of the central/western North Pacific," Hamblin noted. "2012 has cool SSTs in the sub-tropics south and east of Hawaii. 2012 is warm in the Gulf and off the (U.S.) East Coast."
P[L1] D[0x0] M[300x250] OOP[F] ADUNIT[] T[]
In terms of drought, a review of Drought Monitor assessments for the National Weather Service central region, which encompasses the top corn production states, shows this region has more dryness and drought in 2025 than at the same time in 2012. The all-in-one Drought Severity Coverage Index (DSCI) for early May 2025, at 105, is more than twice the index reading of 50 in early May 2012.
Hamblin does note that there are several features which do not lead to a total 2025 versus 2012 comparison. "The (2012) preceding La Nina was stronger than the 2025 version and it lasted longer. There was too much cold water in the eastern North Pacific; (and) there is more precipitation in May this year anticipated than in 2012, which may limit the impacts somewhat," Hamblin said.
Of course, with the corn crop, conditions during the month of July will largely determine final yield. Here's where 2012 was damaging, with heat that was worse than the Dust Bowl years. The NOAA/National Centers for Environmental Information (NCEI) July 2012 U.S. Climate Report noted:
"The average temperature for the contiguous U.S. during July was 77.6 degrees F, 3.3 degrees F above the 20th century average, marking the warmest July and all-time warmest month on record for the nation in a period of record that dates back to 1895. The previous warmest July for the nation was July 1936, when the average U.S. temperature was 77.4 degrees F."
That potential for truly hot conditions in July is key as the past two crop seasons, 2023 and 2024, had most below-normal temperatures in July across the central U.S., which were beneficial for corn pollination. That was not the case in July 2012.
| US Drought Monitor | |||
| Statistics Comparison | |||
| NWS Central Region | |||
| Week of | Week of | ||
| 5/6/2025 | 5/8/2012 | ||
| Drought | % of area | % of area | |
| Category | |||
| None | 39.50% | 63.43% | |
| D0-D4 | 60.50% | 36.57% | |
| D1-D4 | 31.82% | 10.46% | |
| D2-D4 | 9.97% | 2.90% | |
| D3-D4 | 2.23% | 0.00% | |
| D4 | 0.00% | 0.00% | |
| DSCI | 105.00% | 50.00% | |
Bryce Anderson can be reached at bryce.anderson@dtn.com
(c) Copyright 2025 DTN, LLC. All rights reserved.

Comments
To comment, please Log In or Join our Community .