

Top 10 Ag Stories of 2021: No. 6
The Spring of 2021: One-Way Rides to Corn, Soybean Peaks
Editor's Note: Each year, DTN publishes our choices for the top 10 ag news stories of the year, as selected by DTN analysts, editors and reporters. No. 6 is how, in early April of 2021, corn and soybean prices were already trading at their highest levels in more than six years. And then came one more surge higher.
**
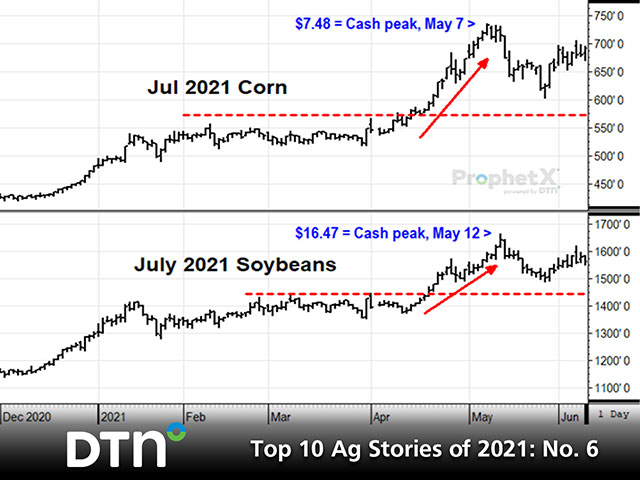
OMAHA (DTN) -- Now seven months later, a bit of the shock may have worn off as we have gotten used to the fact that DTN's National Corn Index actually hit $7.48 on May 7, 2021, and DTN's National Soybean Index followed five days later with a high of $16.47. Prices like that don't come along every day. In fact, DTN's national index of corn prices hadn't been that high since November 2012. For soybeans, it had been two months longer.
It was such a unique achievement that it has become a good lesson for anyone interested in learning more about grain markets. To see what I mean, let's go back to April 9, the day of the most recent World Agricultural Supply and Demand Estimates (WASDE) report before prices made their final surge higher.
At the time, we already knew China had surprised U.S. markets with the largest U.S. corn purchases on record. USDA export sales data showed 2.62 billion bushels (bb) of sales on the books, 917 million bushels (mb) of which was marked for China. July corn futures had traded sideways since February with resistance hovering at the February high of $5.56, corn's highest prices in over six years.
The day before USDA's April report, July corn futures were already hinting at higher prices and closed up 16 cents, posting a new high close of $5.62. When the April WASDE numbers were released, USDA reduced its estimate of U.S. ending corn stocks for 2020-21 from 1.502 bb to 1.352 bb, the lowest in seven years.
P[L1] D[0x0] M[300x250] OOP[F] ADUNIT[] T[]
A few demand estimates were adjusted higher, the largest being a 75 million-bushel (mb) increase in the export estimate to 2.675 bb. USDA's new ending stocks-to-use ratio of 9% historically corresponded to cash corn prices around $4.90, indexed for inflation, but DTN's index of cash corn prices was already at $5.70. It was difficult to know if corn had any more bullish fuel in the tank.
On April 9, soybeans were in a similar situation. July soybeans had been trading sideways in March and early April with resistance at the March high of $14.44 a bushel. China's record purchases had been well known for at least a couple months. USDA's weekly reports showed 2.23 bb of export sales on the books with China accounting for 1.32 bb of the total. The export cards had largely been played.
USDA's April 9 WASDE report kept the estimate of U.S. ending soybean stocks unchanged at 120 mb, a slim 2.6% of annual use and the tightest stocks-to-use ratio for an April report in at least two decades. The history of cash soybean prices suggested a target near $13 a bushel, and DTN's index was already at $13.76, among its highest prices in six years. Markets that tight also have a history of volatile prices.
For both corn and soybeans, it was difficult to say, based on USDA's fundamental assessments, that either price deserved to trade much higher. But as I often say, markets are people and there was still a strong contingent of people willing and needing to buy corn. Based on the strong basis levels and bullish futures spreads at the time, I suspect much of the final rally was fueled by end users late to the party. In hindsight, speculators probably also played a part, as it's difficult for traders to resist markets that went almost straight up from mid-April to early May.
There's much more I could say, but the most practical point to make is that as much effort as many of us put into trying to understand the fundamentals of supply and demand, those assessments are often flawed and did not help in 2020-21. In fact, after corn and soybean prices started trending higher in August 2020, USDA's assessments were chronically too bearish.
I'm not saying fundamentals aren't important, but like every approach, fundamental assessments have their own flaws and can lead to bad decisions. It's also important to consider the market's own clues, things like basis, futures spreads and trends. They're not perfect either, but they were certainly helpful in 2021.
**
Editor's Note:
You can find No. 10 in DTN's top 10 list at https://www.dtnpf.com/….
You can find No. 9 in DTN's top 10 list at https://www.dtnpf.com/…
You can find No. 8 in DTN's top 10 list at https://www.dtnpf.com/…
You can find No. 7 in DTN's top 10 list at https://www.dtnpf.com/…
Todd Hultman can be reached at Todd.Hultman@dtn.com
Follow him on Twitter @ToddHultman1
(c) Copyright 2021 DTN, LLC. All rights reserved.