

Technically Speaking
Wheat: How Low Can Chicago Go?
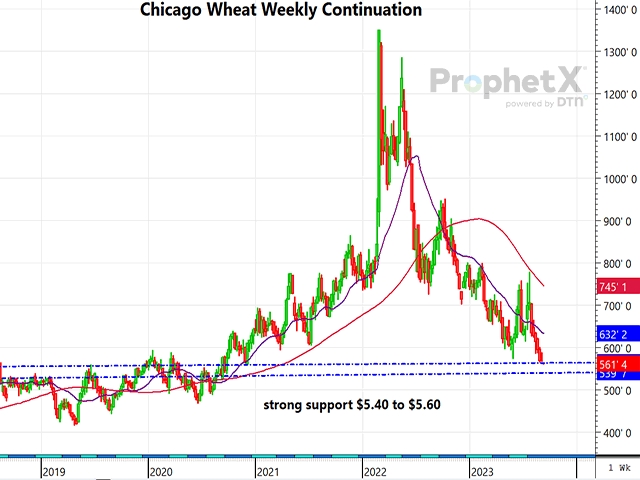
All three wheat markets have been in freefall since reaching a high in February of 2022 after Russia invaded Ukraine. Chicago spot-month futures, as represented on a weekly continuation chart, show Chicago wheat having plunged close to $7.90 per bushel since the end of February 2022. Granted, the U.S. has really not been the beneficiary of the war in Ukraine at all. The Turkey and UN-brokered Black Sea Grain Initiative -- allowing the export of Ukraine grains -- was as or more bearish than the initial invasion was bullish for wheat prices. U.S. wheat export sales leave much to be desired, as Russia and Ukraine dominated most world wheat purchases, and Russia still continues to do so. Consultancy Sov Econ predicts Russian exports will be a record large 48.9 million metric tons (mmt), while U.S. wheat exports have suffered.
While U.S. export demand remains sluggish, funds have re-entered a sizable net-short position in Chicago wheat. According to CFTC, Managed funds are short 83,000 contracts as of Sept. 7. Although the funds are certainly capable of increasing that position even more, this is a market that is getting oversold, and there are some bullish weather and production issues around the world, including Canada, Argentina, and Australia as drought expands in the latter. There appears to be solid support down in the $5.40 to $5.60 area, with Chicago spot-and-expiring September trading just above $5.60 early Monday. In the event of bullish news in wheat, the fund short should be a bullish omen at some point. We just have not reached that point yet. Look for the $5.40 to $5.60 area on the front month to stop the bleeding.
P[L1] D[0x0] M[300x250] OOP[F] ADUNIT[] T[]
For the past three to four weeks, December corn has traded in a narrowing range, bounded by $4.95 on the upside and $4.70-$4.75 on the downside. It appears the market is coiling in a symmetrical triangle chart pattern, with a breakout either side of that range likely to signal the next move in corn. That break out may have a chance to occur following Tuesday's much-anticipated September WASDE report. It would not be a major surprise for USDA to have a surprise corn and/or soybean yield change, as this represents the first objective yield reading. Right now, analysts are projecting lower yields than in July, but the USDA always has a penchant for surprises on report day.
**
The comments above are for educational purposes only and are not meant as specific trade recommendations. The buying and selling of commodities, futures or options involve substantial risk and are not suitable for everyone.
Dana Mantini can be reached at Dana.Mantini@DTN.com
Follow him on X, formerly Twitter, @mantini_r
(c) Copyright 2023 DTN, LLC. All rights reserved.

Comments
To comment, please Log In or Join our Community .