Technically Speaking
Wave Counts Provide Clues in Livestock
Cattle futures entered a consolidation phase following the corrective rally from May 31-June 9. The question for live cattle traders now is whether the consolidative phase is a pause ahead of a retest of the 2022 upper range cap or whether a more aimless, lateral chop is to be expected. The August contract rose above all major moving averages in early June, a sign trends had flipped higher. This week, however, prices have slipped below the 50-day moving average with the 100-day and 200-day sitting just below at $135.14-$135.40. When prices become tangled up in their longer-term moving averages, it is a clear sign consolidative trade has taken hold. Momentum indicators are still trending higher, although have peaked at least in the short-term. Some clear and present risk parameters are needed to navigate this market moving forward. To the upside the $137.95 corrective high from June 9 and to the downside $132.450 from June 13. These are the longer-term directional triggers which need to be violated to definitively be able to say what the next trend is. Short of that, choppy trade between $134 and $137 is likely in our opinion.
AUGUST FEEDER CATTLE:The present technical construct in feeder cattle is not dissimilar to live cattle, but the preceding price action is quite a bit different. Feeder cattle began a long, drawn-out decline stemming from the mid-February contract highs. One could argue a complete, five-wave Elliot sequence concluded with the May lows around $162.800. If that is indeed the case, the price action from those May lows can be either a counter-trend rally ahead of new lows, or the early stages of its own five-wave sequence higher. Regardless of which it is, we would expect any additional weakness to be met with buying and a round of new highs above $176.875 from June 9. The 100-day moving average should offer some support at $171.424, although as long as the lows from May are not violated, the count for higher prices remains alive. Near-term directional triggers would be the $169.400 corrective low from June 13 and the $176.875 corrective high from June 9.
P[L1] D[0x0] M[300x250] OOP[F] ADUNIT[] T[]
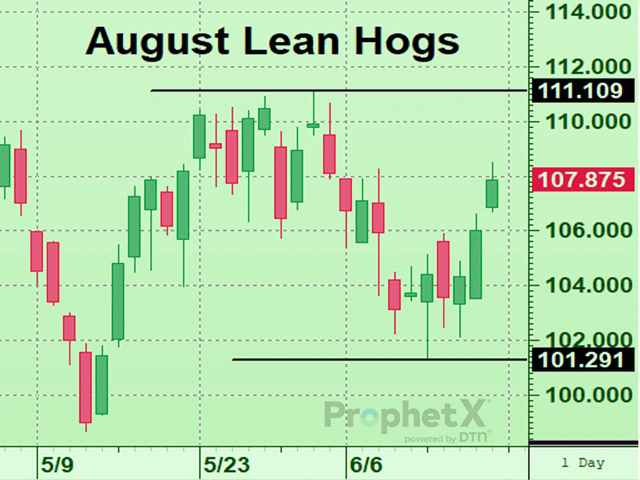
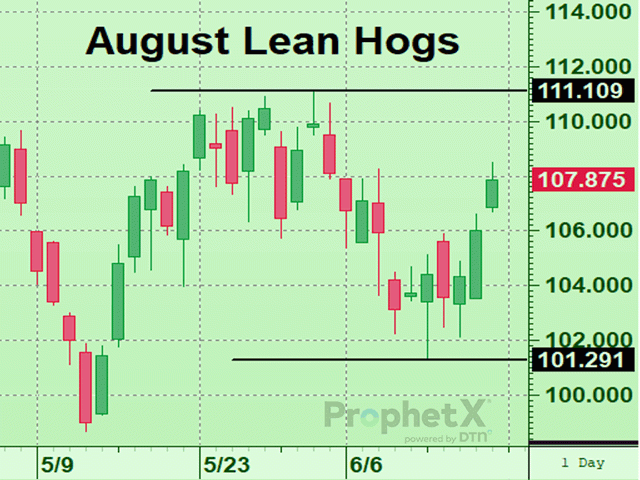
The lean hog market is also offering a master class in Elliot Wave Theory as well as technical trading patterns. Looking back to the trade patterns in February-April, one could make the very real argument the lean hog market sustained a head-and-shoulders reversal pattern after violating the neckline between $107.55-$111.100. To our eye, it now looks as though the hog market is in the midst of a fifth wave to complete the larger degree five wave down from the $123.65 corrective highs on March 31. The counter-trend rally from $101.300 to $108.500 is complicating the count slightly but has not fully negated it until trade above the June 2 high at $111.05 has occurred. Prices are also getting very close to violating trendline resistance stemming from the March, April and June highs. If broken, it would negate our larger five-wave call, and argue for a continuation of the counter-trend rally. These issues considered, a cautiously bearish policy remains advised in this market with additional strength above the $111.05 corrective high needed to negate it. Weakness below $101.300 to $102.100 is needed to support this call, which would argue for new lows below $98.65.
**
Comments above are for educational purposes only and are not meant as specific trade recommendations. The buying and selling of grain or grain futures or options involve substantial risk and are not suitable for everyone.
Todd Hultman can be reached at Todd.Hultman@dtn.com
Follow him on Twitter @ToddHultman1
(c) Copyright 2022 DTN, LLC. All rights reserved.


Comments
To comment, please Log In or Join our Community .