
Technically Speaking
USDX: A Bullish Turn

Last week was interesting for a number of financial markets. The Dow Jones Industrial Average (DJIA) lost 2,160 points from its previous week's close, 3,256 points from its high set just two weeks ago, before rallying 830 points through last Friday's close. Comex Gold closed $21.60 lower for the week, off $49.70 since its high two weeks ago. And the U.S. dollar started to strengthen against foreign currencies, its index (USDX) nearing a confirmation of a move to a secondary (intermediate-term) uptrend on its weekly chart.
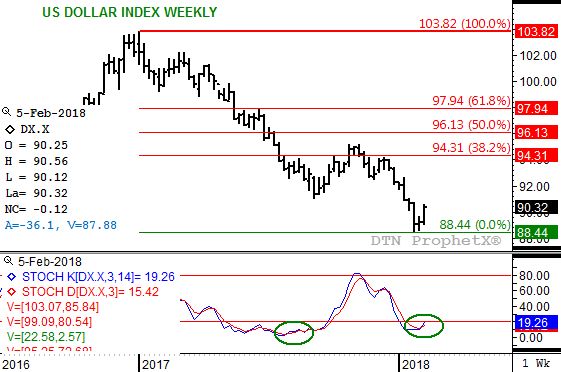
Let's look closer at the USDX, and what it's 1.13 higher weekly close means. First, weekly stochastics (secondary momentum study) established a bullish crossover below the oversold level of 20%. This is a classic signal that momentum is shifting from bearish to bullish, last seen during August 2017. The USDX followed this series of signals with a 4.14 rally (Wave B, second wave), culminating in a double-top at 95.15 that led to Wave C (third wave) of the 3-wave downtrend that looks to have ended last week.
P[L1] D[0x0] M[300x250] OOP[F] ADUNIT[] T[]
Technically, the USDX could confirm a move to a secondary uptrend by establishing a new 4-week high beyond 91.00 this coming week. The USDX finished last Friday at 90.33 after posting a weekly high of 90.57. Given secondary momentum is now bullish, this confirmation should happen early in the week.
Once it does, the upside target for the uptrend is 94.31 to 97.94. These mark the 38.2% and 61.8% retracement levels of the previous secondary downtrend from 103.82 through the recent low of 88.44.
With February nearing its midpoint, the USDX is also approaching a bullish major trend change on its long-term monthly chart. There we see the USDX held above support at 87.26 (recall its recent low of 88.44 from January), with this month's activity putting monthly stochastics (long-term momentum indicator) also in position for a bullish crossover below the oversold level of 20%.
What does this mean for commodities? Gold is already in a secondary downtrend after its weekly stochastics turned bearish the week of January 29 and the more heavily traded April contract posted a new 4-week low last week. Weekly charts for crude oil (both Brent and WTI) are also showing secondary downtrends, while May cotton shows a similar pattern to April gold. Of the key commodities only the more active May corn is not in a secondary downtrend, though it came within a 1/2 cent of establishing a bearish reversal on its weekly chart last week (new-crop December corn did post a bearish outside week though).
With the USDX expected to continue to rally, again likely to establish a new 4-week high early this coming week, commodities in general would be expected to extend recent downtrends and sell-offs.
To track my thoughts on the markets throughout the day, follow me on Twitter:www.twitter.com\Darin Newsom
Comments
To comment, please Log In or Join our Community .