Technically Speaking
Monthly Analysis: Grain Markets
Corn (Cash): The DTN National Corn Index (NCI.X, national average cash price) closed at $3.09 3/4, up 6 1/2 cents for the month. The NCI.X posted a bullish outside month during November, indicating the market could start to build bullish momentum. For now, the major (long-term) trend remains down given the series of lower highs (July 2015, June 2016, and July 2017) and lower lows (October 2014 and August 2016). The 4-month high could be out of reach for December up at $3.32.
Corn (Futures): The December contract closed at $3.55 3/4, up 10 cents on the monthly chart. While the market's major (long-term) trend remains down, corn futures posted a bullish outside month during November. Much of this was due to the roll from December futures to March as the more active contract at a carry of approximately 14 cents, registering on the market's monthly chart. Still, a similar pattern was posted by the NCI.X (see above) indicating corn could start to build bullish momentum.
P[L1] D[0x0] M[300x250] OOP[F] ADUNIT[] T[]
Soybeans (Cash): The DTN National Soybean Index (NSI.X, national average cash price) closed at $9.12 3/4, up 17 1/4 cents for the month. The NSI.X looks to be nearing a bullish breakout on its long-term monthly chart, closing November at trendline resistance of $9.12 3/4. The NSI.X is also within striking distance of posting a 4-month high above $9.22 3/4 (October 2017). Monthly stochastics remain bullish with the previous major (long-term) signal a crossover below the oversold level of 20% from March 2016.
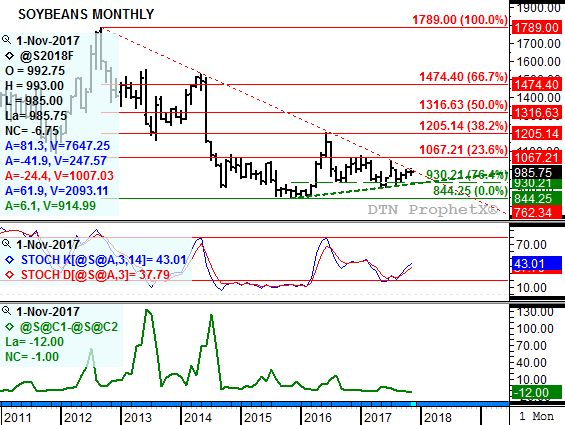
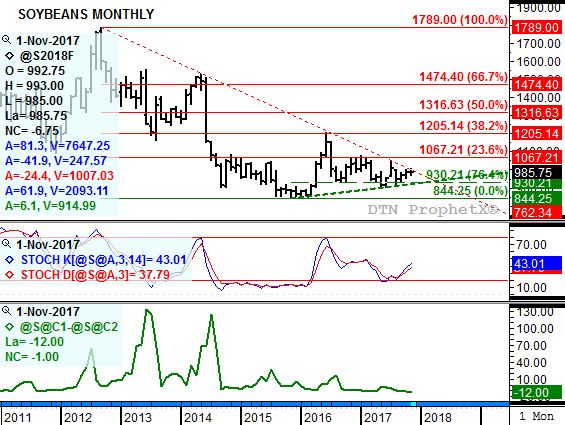
Soybeans (Futures): The January contract closed at $9.85 3/4, up 1 cent on the monthly chart. While soybean futures remain in a major (long-term) consolidation pattern between converging trendlines, the January contract is nearing a bullish breakout. Trendline resistance during December is pegged at $9.94 1/2, less than 10 cents above the November close. Also, the 4-month high is now the November high of $10.08 1/4. Monthly stochastics remain bullish, indicating the market could start to build momentum. However, the carry in the nearby futures spread continues to strengthen reflecting a more bearish view of supply and demand.
HRW Wheat (Cash): The DTN National HRW Wheat Index (HW.X, national average cash price) closed at $3.64, up 15 cents for the month. The HW.X remains in a major (long-term) uptrend, though needing a new 4-month high monthly close to build momentum again. This mark remains the September 2017 close of $3.66 1/4. The HW.X has been consolidating since August 2017 after falling from its spike high monthly close of $4.55 at the end of June 2017.
HRW Wheat (Futures): The March Kansas City (HRW) contract closed at $4.31 1/2, up 15 cents for the month. Like most of the grains, it is difficult to get a good read on Kansas City wheat's long-term monthly chart heading into December. Yes, the market showed a gain of 15 cents for the month but the December-to-March futures spread closed at a carry of 17 cents. Theoretically then, it could be argued futures actually closed lower. Futures could follow the lead of cash, where a major (long-term) uptrend remains in place.
To track my thoughts on the markets throughout the day, follow me on Twitter: www.twitter.com\DarinNewsom


Comments
To comment, please Log In or Join our Community .