
Technically Speaking
A Change in Bean Salads

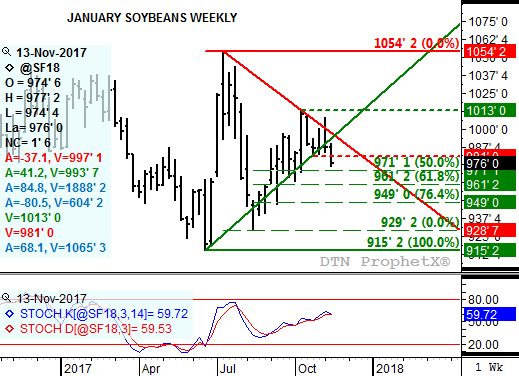
Recently in this blog I've discussed, numerous times, the large wedge pattern on the January soybean weekly chart. Week after week saw the range between trendline resistance and trendline support get smaller, promising a breakout of some kind sooner rather than later. The tension built as Jan beans would threaten an upside breakout, then reverse to a test of support. However, weekly closes near lows the previous two weeks indicated that downside momentum was starting to build.
P[L1] D[0x0] M[300x250] OOP[F] ADUNIT[] T[]
Key to a bullish or bearish breakout would be a move to a new 4-week high of low. The high was posted the week of October 9 at $10.13 (green dotted line). Notice that Jan beans tested this price last week with a high of $10.08 1/4 before falling to a low of $9.83 1/2 and closing at $9.87. This put the contract in position to test, and likely break, support at the 4-week low of $9.81 (dotted red line) from the week of October 23.
Given the divergence between commercial and noncommercial traders, the former growing increasingly bearish and the latter adding to their net-long futures position, a vacuum of few buy orders was expected below the 4-week low. This means that once breached, triggering computer and human sell orders, there would be little to put the brakes on a sell-off. And that's exactly what happened Monday.
The initial breach of the 4-week low meant Jan beans were down 6 cents for the day. In what seemed the blink of an eye the contract found itself 13 cents lower before closing with a loss of 10 1/4 cents at $9.76 3/4. It seems reasonable, regardless of what happens Tuesday, that this coming Friday's CFTC Commitments of Traders report (legacy, futures only) will show a reduction in the noncommercial net-long futures position. Possibly a sizeable reduction at that.
Where to now for Jan beans? Next support is pegged at $9.71, a price that marks the 50% retracement level of the rally from $9.29 1/4 (low the week of August 14) through the $10.13 high. However, with the divergence still strong and commercials continuing to sell, a test of the 61.8% retracement level of $9.61 1/4 or even the 76.4% level of $9.49 is likely over the coming weeks.
To track my thoughts on the markets throughout the day, follow me on Twitter:www.twitter.com\Darin Newsom
Comments
To comment, please Log In or Join our Community .