
Technically Speaking
Monthly Analysis: Livestock Markets
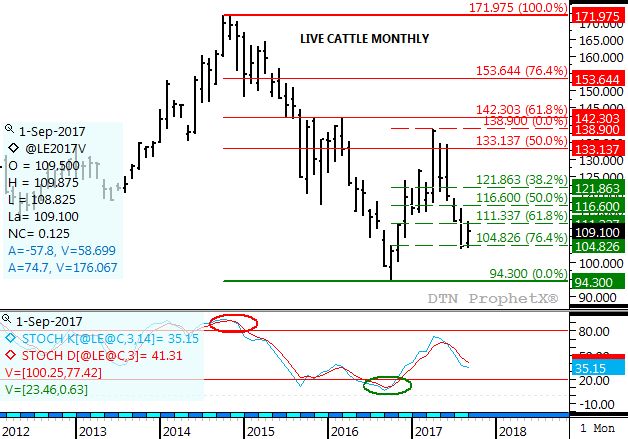
Live Cattle: The October contract closed at $109.10, up $4.575 on the monthly chart. To this point the monthly chart is showing a standard major (long-term) 5-wave uptrend. The October contract has rallied off its test of support at $106.85, the 76.4% retracement level of Wave 1 from $94.30 (October 2016) through the high of $138.90 (April 2017). This large of a retracement is standard for Wave 2. With roll to December as the most-active contract at a premium of more than $6, it looks as if Wave 3 is set to begin.
P[L1] D[0x0] M[300x250] OOP[F] ADUNIT[] T[]
Feeder Cattle: The November contract closed at $154.00, up $10.70 on the monthly chart. The market remains in a major (long-term) 5-wave uptrend with last month's rally the beginning of Wave 5. Given that, feeder cattle should take out the Wave 3 peak of $163.50, a price that tested resistance at $164.725. The next upside target would be $180.20, the 50% retracement level of the previous 3-wave major downtrend from $245.75 through the low of $114.65.
Lean Hogs: The December contract closed at $59.59, down $1.45 on the monthly chart. Indications are that the major (long-term) trend remains down. September saw the more-active contract test support near $57.75 before rallying late in the month. While it's possible the December contract could see a secondary (intermediate-term) uptrend develop, the market's monthly chart would suggest more selling is likely over the long-term.
Corn (Cash): The DTN National Corn Index (NCI.X, national average cash price) closed at $3.10, up 2 cents for the month. The major (long-term) trend remains sideways-to-down. The last three long-term highs have been lower, as have the last two major lows. This would suggest that the August 2016 low of $2.73 is a long-term target. It's interesting to note that the September range for the NCI.X was only 11 1/4 cents between $3.15 and $3.03 3/4.
Soybean meal: The more active December contract closed at $315.80, up $16.30 on the continuous monthly chart. The market still looks to be in a major (long-term) sideways trend between support near $290 and resistance at $340. Extended support and resistance levels are the low of $258.90 (February 2016) and $367.00.
To track my thoughts on the markets throughout the day, follow me on Twitter: www.twitter.com\DarinNewsom


Comments
To comment, please Log In or Join our Community .