

Technically Speaking
Monthly Analysis: Livestock Markets

Live Cattle: The October contract closed at $111.95, down $4.35 on the monthly chart. The market remains in a major (long-term) 5-Wave uptrend that began at the end of October 2016 with a bullish crossover by monthly stochastics below the oversold level of 20%. With stochastics still bullish below the overbought level of 80%, initial resistance is near $125.375, a price that marks the 38.2% retracement level of the previous downtrend from $171.975 (November 2014) through the November 2016 low of $94.30. The July sell-off resulted in a test of support near $110.80, a price that marks the 61.8% retracement level of Wave 3 from $108.675 (April 2017) through the high of $134.55 (May 2017).
P[L1] D[0x0] M[300x250] OOP[F] ADUNIT[] T[]
Feeder Cattle: The August contract closed at $146.175, down $1.75 on the monthly chart. Despite the lower monthly close the market remains in major (long-term) 5-wave uptrend. Support is between $144.85 and $139.075, prices that mark the 38.2% and 50% retracement levels of Wave 1 from $114.65 (October 2016) through $163.50 (May 2017).
Lean Hogs: The October contract closed at $66.025, down $17.725 on the monthly chart. The lean hog monthly chart is another illustration of one of the problems using continuous most active futures. July saw a roll from the August contract to October as the most active, with the spread between the two at approximately $15. This created a bearish reversal on the market's monthly chart, despite the October only losing only $4.425 on its individual monthly chart. However, using a continuous nearby contract monthly chart the August issue still showed a bearish reversal, trading outside its June range before closing $10.325 lower for the month. Both charts would indicate the major (long-term) trend has turned down.
Corn (Cash): The DTN National Corn Index (NCI.X, national average cash price) closed at $3.28, down 6 3/4 cents for the month. The major (long-term) trend remains sideways between the low of $2.81 1/2 (October 2014) and $4.10, a price that marks the 23.6% retracement level of the previous downtrend from $8.26 1/4 (August 2012). The NCI.X continues to hold near the midpoint of this range at $3.39 1/2. Monthly stochastics remain bullish near the midrange level of 50%.
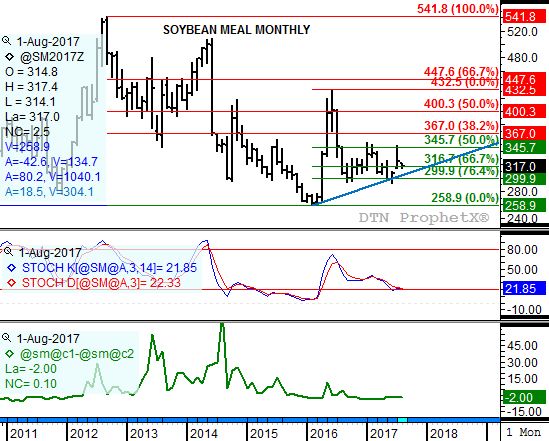
Soybean meal: The more active December contract closed at $325.40, up $19.20 on the continuous monthly chart. Soybean meal posted a bullish gap up last month between the June high of $309.80 and July low of $314.10. This would suggest that the market has resumed its major (long-term) uptrend that began back in March 2016 with a bullish crossover by monthly stochastics below the oversold level of 20%.
To track my thoughts on the markets throughout the day, follow me on Twitter: www.twitter.com\DarinNewsom


Comments
To comment, please Log In or Join our Community .