
Technically Speaking
Weekly Analysis: Corn and Soybean Markets
Corn (Cash): The DTN National Corn Index (NCI.X, national average cash price) closed at $3.47 3/4, up 13 cents for the week. Despite the strong rally the NCI.X remains in a secondary (intermediate-term) sideways trend on its weekly close-only chart. Resistance is at the previous high of $3.48 (week of June 5) and support the low of $3.19 1/4 (week of June 19). Despite last week's rally in the futures market, basis versus the September contract strengthened 1 1/2 cents to 44 3/4 (cents) under.
Corn (Old-crop Futures): The September contract closed 11.50cts higher at $3.92 1/2. The secondary (intermediate-term) trend is sideways. Resistance remains at the recent high of $3.99 1/4 and support the 4-week low of $3.64 1/2. Weekly stochastics are neutral.
P[L1] D[0x0] M[300x250] OOP[F] ADUNIT[] T[]
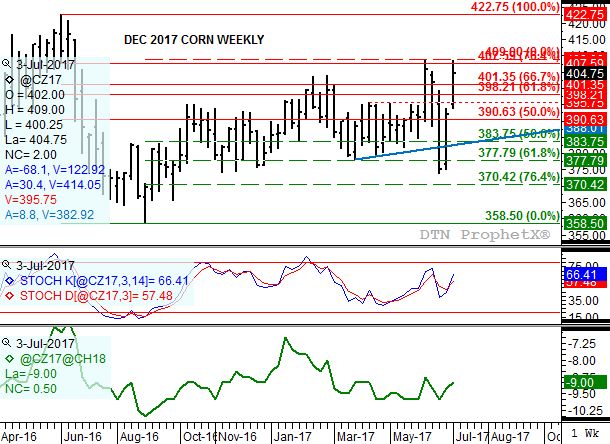
Corn (New-crop Futures): The December 2017 contract closed 12.75cts higher at $4.04 3/4. Dec corn posted conflicting technical signals including a bullish gap between the previous week's high of $3.93 3/4 and last week's low of $3.94 and a bearish double-top at $4.09. Neutral-to-bullish weekly stochastics combined with the contract's major (long-term) uptrend would suggest a bullish breakout next week, with major targets up at $4.30 1/4 and $4.47. The latter not only marks the 76.4% retracement level of the contract's previous major downtrend from $4.74 1/2 to $3.58 1/2, but would also fulfill the measured target of $4.44 arrived at by adding the range ($0.35) from the double-top through the interim low ($3.74) to the bullish break of the $4.09 mark.
Soybeans (Cash): The DTN National Soybean Index (NSI.X, national average cash price) closed at $9.35 3/4, up 55 cents for the week. After establishing a 2-week reversal, the NSI.X left an impressive bullish price gap between the previous week's high of $8.80 3/4 and last week's low of $9.03 1/4. With cash soybeans' secondary (intermediate-term) uptrend strengthening, next resistance is near $9.43 3/4 then $9.76. These price mark the 38.2% and 50% retracement levels of the previous downtrend from $11.12 through the low of $8.40. The 61.8% retracement level is up at $10.18.
Soybeans (Old-crop Futures): The August contract closed at $10.01, up 54 cents for the week. Similar to the NSI.X, August soybeans left a bullish price gap after establishing a 2-week reversal, confirming the secondary (intermediate-term) trend is up. The August contract has already cleared resistance at $9.96 1/4, a price that marks the 50% retracement level of its previous downtrend from $10.88 through the low of $9.04 1/2. Next resistance is at $10.17 3/4 and $10.44 1/2, prices that mark the 61.8% and 76.4% retracement levels.
Soybeans (New-crop Futures): The November 2017 contract closed at $10.15 1/2 up 60 3/4 cents for the week. Similar to cash and old-crop August, new-crop November left a bullish price gap after establishing a 2-week reversal, confirming the secondary (intermediate-term) trend is up and strengthening. The Nov contract has cleared resistance at $10.10 3/4, a price that marks the 76.4% retracement level of its previous downtrend from $10.43 through the low of $9.07. Next resistance is at the previous high.
To track my thoughts on the markets throughout the day, follow me on Twitter: www.twitter.com\DarinNewsom

Comments
To comment, please Log In or Join our Community .