

Technically Speaking
The Downturn in New-Crop Soybeans
There are a number of interesting things showing up on the November 2017 soybean (SX7) weekly chart, and all of them technically bearish.
First note that this week's low (through early Friday morning) of $9.81 is a new 4-week low. Those familiar with my analysis know this is a decent indicator of momentum change, confirming the market has moved into a secondary (intermediate-term) downtrend.
P[L1] D[0x0] M[300x250] OOP[F] ADUNIT[] T[]
Speaking of momentum, weekly stochastics (bottom study, technical momentum indicator) are growing more bearish following a crossover above the overbought level of 80% at the end of last week. The most observant of you will note a bearish crossover also occurred the week of June 13, in conjunction with the previous peak of $10.22 3/4. Yet SX7 just recently posted a new high of $10.43 the week of November 28. What makes this momentum switch different?
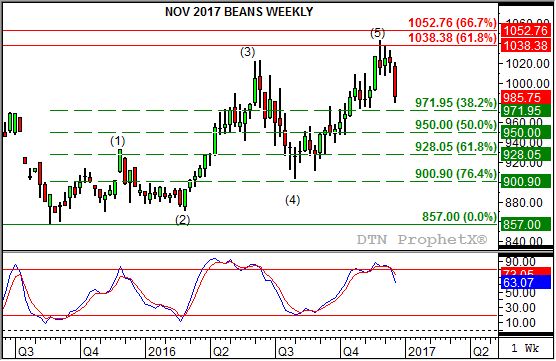
To answer that let's look at the 5-Wave uptrend pattern as a whole, starting with its initial low of $8.57 the week of August 24, 2015. The rally up to $9.32 3/4 (week of November 15, 2015) was Wave 1. Characteristically, Wave 2 tends to retrace nearly all of Wave 1. This was once again the case as SX7 posted a low of $8.71 1/4 the week of February 29.
Wave 3 tends to show a strong extension, with this one doing just that as SX7 raced to the aforementioned high of $10.22 3/4. By definition Wave 4 doesn’t usually dip below the peak of Wave 1, but in this case it did as SX7 fell to a low of $9.03 1/2 the week of August 1. Wave 5 usually leads to the exhaustion of bullish sentiment and momentum. Again note how quickly SX7 fell to a new 4-week low from its previously mentioned peak of $10.43.
So about those stochastics: Note the market saw a bullish crossover below 20% in conjunction with the initial August 2015 low of $8.57. Wave 2 did not create a bearish crossover above 80% (the key), while Wave 3 was likewise with another bullish crossover. By the time we reached the bearish crossover in June 2016 the market gave us a warning the uptrend was in its final stages. Once again Wave 4 did not see momentum drop all the way below 20%, setting the stage for the final Wave 5.
It should also be noted that the entirety of the 5-Wave uptrend was contained by resistance between $10.38 1/2 and $10.52 3/4. These prices mark the 61.8% and 67% retracement levels of the contracts previous secondary downtrend from its high of $11.50 1/2 through the $8.57 low.
How low might SX7 go? First support is pegged near $9.72, a price that would also fit the normal 4-year seasonal downtrend that lasts through early February. Such a move would be Wave A of the newly established 3-Wave downtrend, with Wave B retracing a percentage of Wave A. How much retracement that might be depends on the bullishness or bearishness of futures spreads. From there, again dependent on spreads, SX7 would be expected to test the 61.8% to 76.4% retracement area between $9.28 and $9.01.
To track my thoughts on the markets throughout the day, follow me on Twitter: www.twitter.com\DarinNewsom

Comments
To comment, please Log In or Join our Community .