

Technically Speaking
A Now, A Message From Oats

Say it with me: "Oats knows where corn goes."
Very nice. We all remember that old, if not flawed, market adage. And while it may not be true, necessarily, corn market bulls are crossing their fingers that it just might play out this time around.
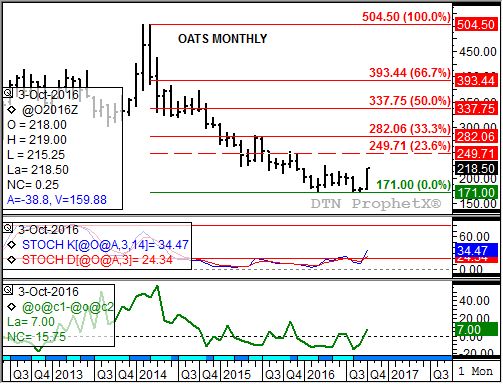
Why is that, you ask? Take a look at oats' monthly chart. After posting a new low of $1.71 in September the December contract has rocketed to a high of $2.19 this month, a price posted this past overnight session. This is the highest the futures market has been since last April when it peaked at $2.24 3/4.
P[L1] D[0x0] M[300x250] OOP[F] ADUNIT[] T[]
Take a look at monthly stochastics (long-term momentum, middle study). Note that the most active contract was below the oversold level of 20% for about two years, shaking off a number of potential bullish crossovers that would have indicated a possible turn in the major (long-term) trend. A bullish crossover occurs when the faster moving stochastic (blue line) crosses above the slower moving stochastic (red line), with both below the oversold level of 20%.
What couldn't change was the continued grind lower by the futures market, as time after time it failed to make a new 4-month high*. But not this time. The previous 4-month high $2.13 1/4 was taken out last Friday as Dec oats stretched its secondary (intermediate-term) rally to $2.18 3/4. These bullish signals on weekly and monthly charts, combined with the previous bullish crossovers by monthly stochastics, indicate the major trend is now up.
Given this long-term change in direction, the initial target is now near $2.49 3/4. This price marks the 23.6% retracement level of the previous major downtrend from $5.04 1/2 (March 2014) through the September 2016 low. Beyond that is the 33% retracement level of $2.82.
However, and here's where it gets fun, the market's forward curve is inverted. In other words the December contract is higher priced than the March (bottom line chart), which is itself priced above the May 2017 issue. And as we all know, an inverted forward curve tends to reflect a bullish commercial outlook. Therefore, and recalling that a bullish forward curve can lead to at least a 50% retracement of the previous trend, the target becomes $3.37 3/4.
So what does all of this mean for corn? If oats actually acts as a scout for the King it could either recreate those at Custer's last stand or become another J.E.B. Stuart (of Confederate fame). Time will tell. But corn's long-term monthly chart is also hinting at turning bullish (again). More on that later.
*Those of you familiar with this blog know the importance I put on the Rule of 4. One of the key turn signals I look for is a new 4-week or 4-month high, the latter being more important than the former due to the length of time covered. There is also the short-term 4-day signal, but I pay little attention to those due to higher volatility in markets these days.
To track my thoughts on the markets throughout the day, follow me on Twitter: www.twitter.com\DarinNewsom
Comments
To comment, please Log In or Join our Community .