

Technically Speaking
Dec Corn: It's Hammer Time
Those of you who have followed along with this blog for years know Idon't often discuss candlestick charts, preferring to focus on bar charts instead. Yet I do keep an eye on them, particularly when things start to get interesting for a market.
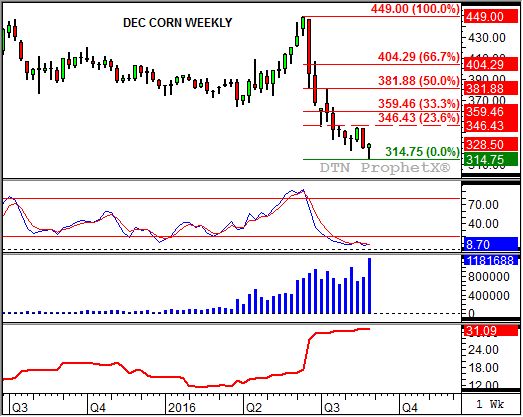
Such is the case following last week's action in December corn. The contract opened last Monday at $3.25, fell to a low of $3.14 3/4 Wednesday, rallied to a high of $3.29 3/4 Friday, before closing the week at $3.28 1/2. This activity looks a little different on a candlestick chart, with the point being green body (range between the week's open and close) occurring near the week's high. This leaves a long lower shadow that was at least twice the height of the real body (13 3/4 cents vs. 3 1/2 cents) and a very short upper shadow (1 1/4 cents).
With all three criteria for a bullish hammer met, what does it mean? Generally, it indicates the market it occurs in is "hammering" out a bottom formation or base. In other words the trend, in this the secondary (intermediate-term), is in the process of changing from down to up.
Often a hammer is followed by a retest of support, in this case last week's low of $3.14 3/4, before turning higher. Nevertheless, December corn has a more bullish look to it this week if we add in other technical factors of weekly stochastics nearing a bullish crossover below the oversold level of 20% (second study) and an increase in weekly volume (third study) as the contract posted a higher close.
To track my thoughts on the markets throughout the day, follow me on Twitter: www.twitter.com\DarinNewsom
P[L1] D[0x0] M[300x250] OOP[F] ADUNIT[] T[]

Comments
To comment, please Log In or Join our Community .