

Technically Speaking
Monthly Analysis: Grain Markets
Corn (Cash): The DTN National Corn Index (NCI.X, national average cash price) closed at $2.95 1/4, up 22 1/4 cents for the month. It could still be argued that the major trend is sideways between support at the combined lows of $2.8147 (October 2014) and $2.7302 (August 2016), and resistance between the peaks of $4.05 3/4 (July 2015) and $4.00 1/2 (June 2016). Monthly stochastics are nearing a bullish crossover below the oversold level of 20%.
Corn (Futures): The December contract closed at $3.36 3/4, up 21 1/4 cents on the monthly chart. Trend patterns are similar to what was described in the cash corn analysis. For now the major (long-term) could be classified as sideways, with monthly stochastics below 20%. Support is at the rough double-bottom between $3.18 1/4 (October 2014) and $3.14 3/4 (August 2016). Resistance is between $4.54 1/4 (July 2015) and $4.39 1/4 (June 2016).
P[L1] D[0x0] M[300x250] OOP[F] ADUNIT[] T[]
Soybeans (Cash): The DTN National Soybean Index (NSI.X, national average cash price) closed at $8.91, down 18 1/4 cents for the month. The NSI.X remains in a major (long-term) 5-Wave uptrend with the ongoing secondary (intermediate-term) downtrend a Wave 2 move. September's low of $8.84 was a test support at $8.77 1/2, a price that marks the 76.4% retracement level of Wave 1 from $8.05 (March 2016 low) through the double-top high of $11.12 (June 2016, July 2016). A normal Wave 2 tends to produce a deep retracement of Wave 1, meaning continued pressure could be seen.
Soybeans (Futures): The November contract closed at $9.54, up 11 cents on the monthly chart. While the market remains in a major (long-term) 5-Wave uptrend the secondary (intermediate-term) trend of the November futures contract is down. The September low of $9.34 was a test of support at $9.30 1/4, a price that marks the 76.4% retracement level of Wave 1 from $8.44 1/4 (November 2015) through the high of $12.08 1/2 (June 2016). Remember that a normal Wave 2 sees a deep retracement of Wave 1.
SRW Wheat (Cash): The DTN National SRW Wheat Index (SR.X, national average cash price) closed at $3.52, up 20 1/4 cents for the month. The major (long-term) downtrend looks to have come to an end following a bullish crossover below 20% by monthly stochastics.
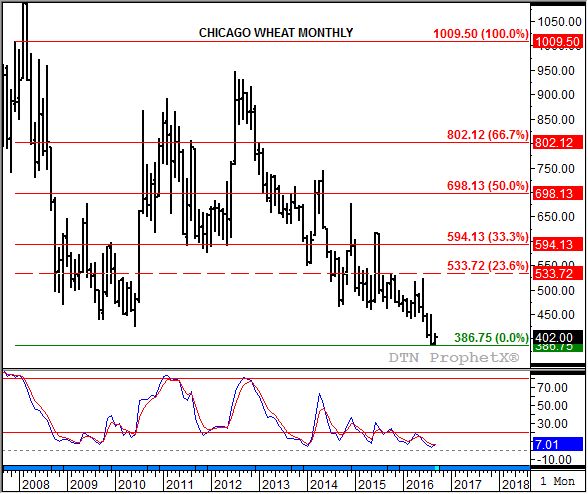
SRW Wheat (Futures): The December Chicago contract closed at $4.02, UP 13 3/4 cents for the month. The major (long-term) downtrend looks to have come to an end following a bullish crossover below the oversold level of 20% by monthly stochastics. However, this is only the latest in a long series of such crossovers that have not resulted in a changed trend.
To track my thoughts on the markets throughout the day, follow me on Twitter: www.twitter.com\DarinNewsom

Comments
To comment, please Log In or Join our Community .