

Technically Speaking
Monthly Analysis: Oilseed Markets
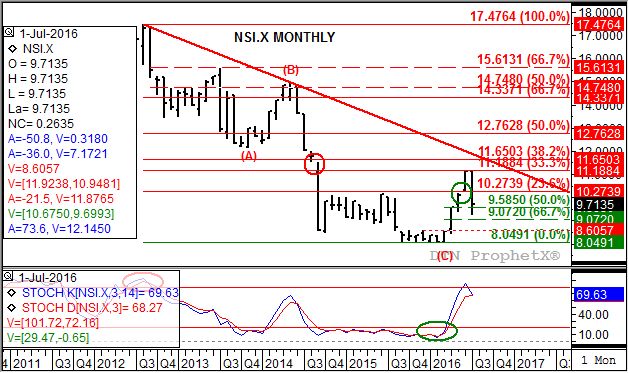
Soybeans (Cash): The DTN National Soybean Index (NSI.X, national average cash price) closed at $9.71 1/4, down $1.40 3/4 for the month. The NSI.X fell back from its test of resistance at $11.18 3/4, establishing a Wave 1 high of $11.12 in both June and July. The market's secondary (intermediate-term) downtrend could be seen as Wave 2 of a 5-Wave major (long-term) uptrend, testing support between $9.58 1/2 and $9.07 1/4. These prices mark the 50% and 67% retracement levels of Wave 1 from $8.05 through the June/July highs.
Soybeans (Futures): The more active November contract closed at $10.03, down $1.50 1/4 on the monthly chart. While the market remains in a major (long-term) 5-Wave uptrend the secondary (intermediate-term) trend of the November futures contract is down. Secondary support is pegged at $9.62 while major support is at $9.65 1/2. However, Wave 2 could extend down to at least $9.30 in the coming weeks.
P[L1] D[0x0] M[300x250] OOP[F] ADUNIT[] T[]
Soybean meal: The more active December contract closed at $347.70, down $53.30 on the continuous monthly chart. The market remains in a secondary (intermediate-term) downtrend that could extend to near $316.70. This price marks the 67% retracement level of the Dec contract's previous secondary uptrend from $258.90 through the high of $432.50. While the monthly chart continues to show a major (long-term0 5-Wave uptrend, this secondary downtrend would represent a Wave 2 retracement. Seasonally soybean meal tends to stay under pressure through September.
Soybean oil: The more active September contract closed at 30.85, down 1.22 on the monthly chart. The market remains in a major (long-term) 5-Wave uptrend while the secondary (intermediate-term) trend is down, Wave 2 of the long-term pattern. The weekly chart shows September bean oil to be oversold, indicating this secondary downtrend could soon come to an end as it tests major support between 30.55 and 28.94 on the monthly chart.
Canola: The November contract closed at $453.90, down $41.80 on the continuous monthly chart. The market remains in a major (long-term) sideways trend with initial support at the March 2016 low of $435.50, then the September 2014 low of $388. Resistance is at a series of highs, starting with July 2015, near $540.
Malaysian Palm Oil (Futures): The October contract closed at 2,316 ringgits, down 37 ringgits on the monthly chart. The major (long-term) trend remains down after a bearish crossover by monthly stochastic at the end of April 2016. The more active October contract was able to rally off July's test of support at 2,173, a price that marks the 67% retracement level of the previous uptrend from 1,863 (August 2015 low) through 2,793 (March 2016 high).
To track my thoughts on the markets throughout the day, follow me on Twitter: www.twitter.com\DarinNewsom

Comments
To comment, please Log In or Join our Community .