

Technically Speaking
Euro: No Longer a 4-Letter Word
For years, in this case dating back to 2008, the euro has basically been a four-letter word not uttered in the polite crowd known as the global investment community. However, the last year has shown that like "feet" (you'll have to look that one up) saying "euro" doesn't mean something dirty.
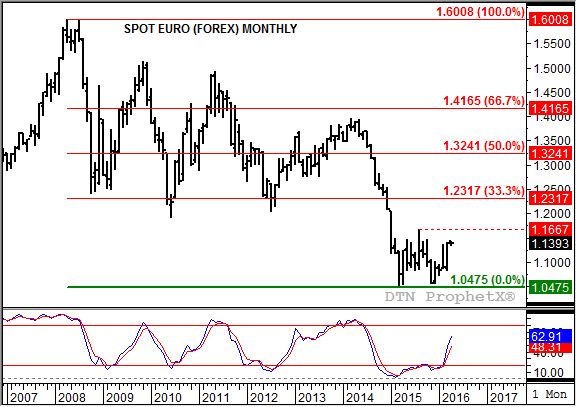
If we take a look at the euro's long-term monthly chart, it is easy to see just how foul the currency had become. Starting with its high of 1.6008 posted in April 2008 (including the double-top of 1.5996 in July that same year) the euro has generally been under pressure. Following a series of waves marked by lower peaks, it finally hit the skids during December 2014 culminating in a low of 1.0475 posted in March 2015.
P[L1] D[0x0] M[300x250] OOP[F] ADUNIT[] T[]
At that point the euro stabilized, rallying to a high of 1.1667 that August. The next dip saw the euro close near its low 1.0560 last November, on the precipice of falling off the cliff to new lows. But a funny thing happened in December, the euro fought back. By the time January was over, despite consolidation in the market itself, monthly stochastics (bottom study) had established a secondary bullish crossover confirming the original posted at the end of April 2015.
Building on this double-bottom (March 2015, November 2015), the euro extended its rally to a new 4-month high in March 2016 of 1.1404. With monthly stochastics continuing to grow more bullish thee euro could soon challenge the interim high (of the double-bottom pattern) at 1.1667 from August 2015 (dashed red line).
Here's where things could really get interesting. If the euro is able to move through the August 2015 peak, then a simple measuring technique would put the upside target near 1.2800, or somewhere between the 33% and 50% retracement levels of the previous major downtrend.
As I said, the math is simple: Drawing a trendline between the March 2015 and November 2015 lows crosses August of that year, the month the interim high was posted, at 1.0528. The difference between this point and the high (1.1667 - 1.0528) is 0.1139. Adding that to a bullish breakout above the August 2015 mark (1.1667 + 0.1139) sets the target just a few ticks north of 1.2800.
What does all of this mean in the big picture? As most of you know, I've been technically bearish the U.S. dollar index (USDX) for quite some time. A bullish euro would add more weight to the bearish technical argument for the USDX. And as I talked about in this blog back on March 18 (The End of the Death March in Commodities), this could provide an even more bullish spark to the commodity sector that tends to show a strong inverse to the USDX.
To track my thoughts on the markets throughout the day, follow me on Twitter:www.twitter.com\Darin Newsom

Comments
To comment, please Log In or Join our Community .