
Technically Speaking
Bullish Possibilities in Dec Corn

While the argument could be made that there is nothing technical about Dec corn these days, that the only thing setting price direction is the recent ludicrous USDA acreage number, a look at the contract's daily chart would suggest otherwise. As of early Tuesday morning there are a number of technical signals at work, many of which had already indicated a bearish tone well before the release of last Friday's reports.
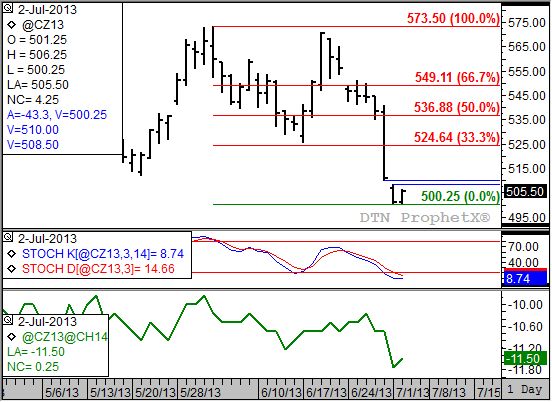
Take a look at the attached daily chart and look back to when the recent high of $5.73 1/2 was established. This occurred on June 3 as the contract traded above the previous day's high, below the previous day's low of $5.57 3/4, and closed lower for the day. This is a classic bearish key reversal, and it happened to occur in conjunction with a bearish crossover in daily stochastics (middle study) where the faster moving blue line crossed below the slower moving red line with both above 80% (83.8% to 84.8%).
P[L1] D[0x0] M[300x250] OOP[F] ADUNIT[] T[]
The combination of a bearish key reversal and a bearish crossover in stochastics is a good indication that lower prices are to come. And initially the contract did fall to a low of $5.25 3/4 on June 17. But notice that daily stochastics did not move below the oversold level of 20% before the faster blue line crossed back above the slower red line. This tends to lead to a sideways trading pattern meaning the previous high could be challenged, but most likely not taken out.
The subsequent rally saw Dec corn post a high of $5.71 (June 19) before moving into a short two-day consolidation period. A bearish breakaway gap on Monday, June 24 where the high was $5.49 1/4 compared to the previous Friday's low of $5.53 3/4 reestablished the downtrend in the futures market and daily stochastics. From there the contract has worked lower, highlighted by this past Friday's sharp sell-off following the release of USDA's acreage number.
But that is all behind us, so we now look ahead. The open of trade Sunday evening saw another bearish gap (between the two blue lines, top chart) from Friday's low of $5.10 and the Sunday night high of $5.08 1/2. This could be viewed as either a runaway gap (continuation pattern) or exhaustion gap (end of previous trend). Given that daily stochastics have moved below the 20% level with this sell-off, indicating the contract is technically oversold, the minor (short-term) downtrend in corn could be coming to an end.
It will be interesting to see what happens over the balance of this holiday-shortened week. If Dec corn continues to hold above $5.00, a price that reflects the 61.8% (Fibonacci) retracement of the previous major (long-term, monthly chart) uptrend from the June 2010 low of $3.98 1/4 through the September 2012 high of $6.65, and the contract sees a bullish crossover in stochastics below 20%, an uptrend could soon emerge. What would make this scenario even more intriguing is if the bullish crossover by stochastics is in conjunction with a bullish gap higher in the futures contract, establishing a classic "island bottom" formation.
As for a possible price target, initial resistance is pegged near $5.24 1/2 and $5.37. These prices mark the 33% and 50% (Dow) retracement levels of the ongoing downtrend from June 2013 high through Tuesday's previously mentioned low. Given that the carry in the December to March futures spread (bottom study) remains a neutral to bearish level of full commercial carry (approximately 56%) the maximum high side target would be the 50% retracement level near $5.37. However, the five-year seasonal index (not shown) indicates the Dec corn contract tends to rally 7% from its close the week of June ($5.15 in 2013) through the final weekly close in August. This establishes a possible price target near $5.50, or roughly the 67% retracement level of the initial downtrend. If this holds true it would suggest a bullish change could be seen in the commercial outlook, meaning the carry moving from neutral-bearish to neutral-bullish.
Stay tuned. It promises to be an interesting week.
To track my thoughts on the markets throughout the day, follow me on Twitter: www.twitter.com\DarinNewsom
Comments
To comment, please Log In or Join our Community .