

Minding Ag's Business
Digital Yield Tour Gears Up for Aug. 8-12, 2022

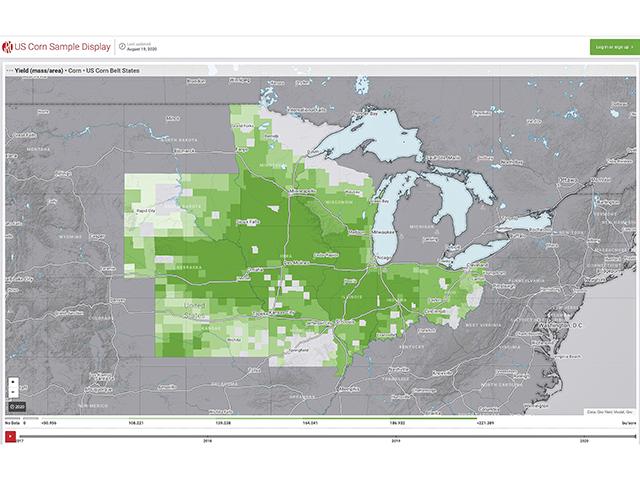
This August, DTN/Progressive Farmer will conduct the fifth annual Digital Yield Tour, powered by Gro Intelligence. The tour harnesses the power of artificial intelligence and machine learning to develop a 30,000-foot view of how the nation's corn and soybean crops are progressing, giving readers early insight into one of the grain market's driving forces.
Gro Intelligence's models harvest a wide array of data -- NASA's satellite imagery, precipitation, soil moisture, weather forecasts and so much more -- to generate yield estimates at the district level. Those are then computed into county and state averages, which then make a national estimate.
It's a very different approach than traditional, boots-on-the-ground crop tours. I've been on many such tours, which rely on an element of randomness in picking fields and spots within them to sample. The objective is to get enough samples over a large enough area to counter any human bias that creeps into the estimate; but every year, these tours are accused of cherry-picking.
The other issue with traditional tours is the formula that's used to calculate corn yields. They're simple, and that's by design. It's a lot harder to make mistakes when you're taking an estimate of plant population, measuring the length of grain and counting kernels around the ear.
P[L1] D[0x0] M[300x250] OOP[F] ADUNIT[] T[]
Last summer, I did yield checks with an Indiana farmer where this formula was off by more than 30 bushels per acre. He figured the discrepancy was in the average test weight used in the formula. Today's corn hybrids can pack on more weight under the right conditions than these formulas were designed to calculate, and yet the same formula is used each year to help the tour develop a data set.
When you rely on satellite data, you have none of these problems. Satellites don't cherry-pick fields; they capture every field in the county. The algorithms and machine learning adjust for weather that could cause large, heavy kernels or small, light ones.
Now, with four years of data under our belt, we can confidently say that the digital approach is just as good, if not better, than traditional tours. The Digital Yield Tour measures success by comparing its August estimates to USDA's final crop projection that is published in January.
As farmers well know, there's a lot that can influence yields between mid-August and harvest, especially in the case of soybeans. Over the history of our tour, Gro's national yield estimates have been within 2.7% of USDA's final corn estimate and 3.2% of the soybean estimate. For comparison, USDA's own September crop estimates, which are the first to integrate field-level data, have been within 2.3% of the final corn yield estimate and 3.8% of the final soybean estimate.
We are looking forward to the DTN/Progressive Farmer 2022 Digital Yield Tour, which will run on dtnpf.com the week of Aug. 8. We'll kick it off with national yield estimates and share breakdowns from the Top 10 corn- and soybean-producing states. Each year, we share Gro's interactive displays, and I'd like to invite you to check out their estimates for your county and let us know what you think by emailing talk@dtn.com.
Review the tour's findings on https://www.dtnpf.com/… and on Twitter using the hashtag #dtnyieldtour22
Katie Dehlinger can be reached at katie.dehlinger@dtn.com
Follow her on Twitter @KatieD_DTN
(c) Copyright 2022 DTN, LLC. All rights reserved.
Comments
To comment, please Log In or Join our Community .