


Fundamentally Speaking
Corn/Soybean Yield Ratios
It was quite a surprise in the October WASDE report when USDA hiked the U.S. corn yield by 2.7 bushels per acre (bpa) to 181.2 bpa, the second best ever next to the year ago 186.5 figure, though still below trend.
The 2026 soybean yield did edge up to 53.1 bpa and that is a new record above the year ago 53.0.
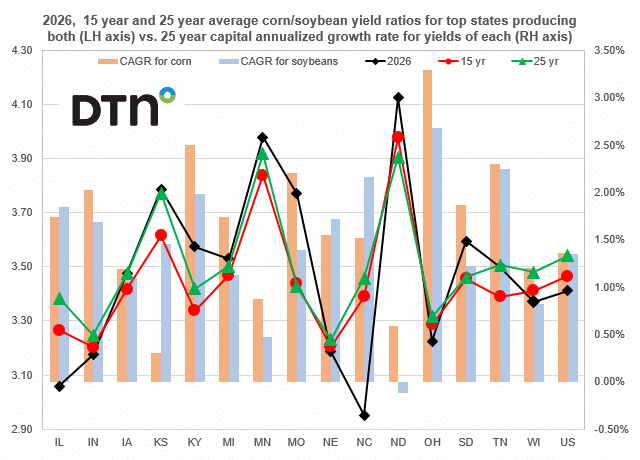
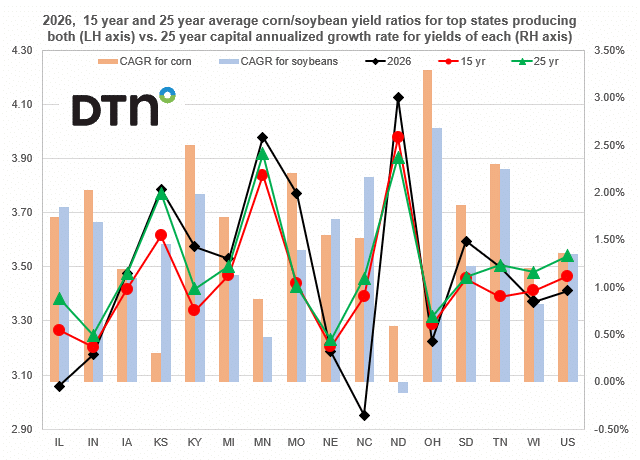
This graphic shows their comparative yields as plotted on the left-hand axis is the 2026 corn/soybean yield ratio along with the 15- and 25-year yield ratio averages for the top 15 states producing both along with the U.S. figures.
P[L1] D[0x0] M[300x250] OOP[F] ADUNIT[] T[]
Reported on the right-hand axis is the 25-year capitalized annual growth rate (CAGR) for both corn and soybean yields.
The U.S. 2026 corn/soybean yield ratio at 3.41 is below both the 15- and 25-year averages so one can say soybean yields held up comparatively better than corn yields this year.
Interestingly, both U.S. corn and soybean yields have increased by a 1.35% rate per year since 2002.
The highest corn soybean yield ratios this year were seen in both North Dakota at 4.13 and Minnesota at 3.98 and that is no surprise as these two northern states have the highest 15- and 25-year corn/soybean yield ratios.
ND has the second lowest CAGR for corn yields at 0.59% next to KS at 0.30% and actually a negative CAGR for soybeans at -0.12% for the lowest, followed by MN at 0.48%.
The lowest corn/soybean yield ratio for the top states this year is North Carolina at 2.95 as their corn yield at 121 bpa is very subpar yet their bean yield at 41 bpa is a new record.
Top producer Illinois is also seeing their corn yields fare quite a bit worse than their soybean crop this season.
We see the highest CAGR rates for both corn and soybeans in OH, TN and KY with all three states seeing good row crop results for 2026.
(c) Copyright 2026 DTN, LLC. All rights reserved.
Comments
To comment, please Log In or Join our Community .