Fundamentally Speaking
US Soybean Planted Area Falls
USDA's planted acreage estimates for the 2024/25 season were released at their annual Ag Outlook Forum earlier this month.
The combined area for corn and soybeans is expected to reach 178.5 million acres, up slightly compared to last year's 178.2 million, despite forward prices of both well below year ago levels.
Corn area was put at 91.0 million, down from 94.6 million last year, due to shifts in relative prices while soybean seedings pegged at 87.5 million, up from 83.6 million in 2023 are linked to stronger demand for the domestic crush largely driven by growth in biofuel use.
After the USDA economists issue their planted acreage projections, they will survey a number of farmers on what their planting intentions are and release those on March 31.
P[L1] D[0x0] M[300x250] OOP[F] ADUNIT[] T[]
These figures will be updated at the end of June and then a final figure will be given in the annual production report in January.
There can be large differences between the March Prospective Plantings, June Acreage, and final production numbers for planted area of the major crops, especially in soybeans where changing prices and Mother Nature can have a large say in what farmers intend to put in the ground and what they actually seed.
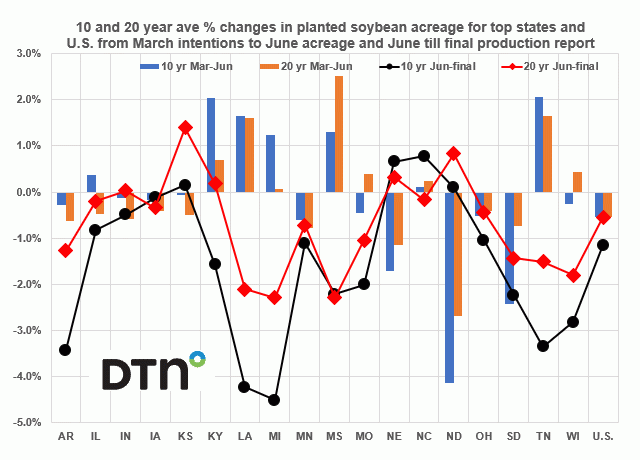
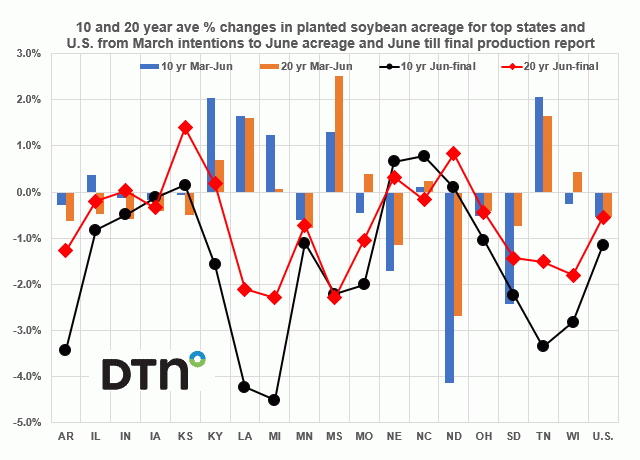
This graph shows the 10- and 20-year average percent changes in planted soybean acreage for the top 18 growing states and the U.S. from the March intentions to the June acreage reports and then the June Acreage figures until the final production report numbers.
Over the past 10 years the average change in U.S. bean planted area from the March intentions to the June acreage report is down 0.5% with the 20-year average also down 0.5%.
Then from the June acreage report to the final production figures the average change in bean planted area is down 1.1% for the 10-year average with the 20-year average down 0.5%.
We should note that the past two years have seen large declines in bean planted area from the March intentions to the final report of 3.9% in 2022 and down 4.5% last year.
A look at the top state figures shows acreage falling from the March intentions to the June acreage numbers particularly for NE, ND, and SD.
For the Dakotas this is likely due to weather as could be in years of delayed corn seedings means it gets too late in the season up there to put soybeans in the ground.
For the June to final report acreage, most states actually see planted area fall as over the past ten years from the June Acreage figures till the final production report numbers, soybean seeded area has fallen by an average of over 3% in AR, LA, MI and TN.
(c) Copyright 2024 DTN, LLC. All rights reserved.


Comments
To comment, please Log In or Join our Community .