Fundamentally Speaking
Grain and Oilseeds Spiral Lower
Grain and oilseed markets continue to spiral lower save for a short-covering rally here or there such as we saw Tuesday after the long holiday weekend.
The list of bearish factors for the old crop situation remain unchanged with forecasts for record South American corn and soybean production still on track, an export sales pace for soybeans and wheat well below what USDA has projected with corn export window soon to close.
Add to that a lack of significant buying from China linked to their sluggish economic performance that has undermined both their food and feed demand and incessant selling by the funds as no bullish factor has yet emerged that could prompt them to perhaps cover some of their close to record short positions.
P[L1] D[0x0] M[300x250] OOP[F] ADUNIT[] T[]
Now additional negative considerations have surfaced for new crop with the USDA at its Ag Outlook sessions last week forecasting record U.S. corn and soybean yields this coming season and the prospect of Fed monetary policy staying tighter far longer than had been expected.
One factor not being talked about much is the possibility that China could see a large jump in their corn and soybean yields if as they say they will start incorporating more GMO seeds in their plantings.
All this points to large carryouts and stocks-to-use ratios for the major crops for the coming 2024/25 season.
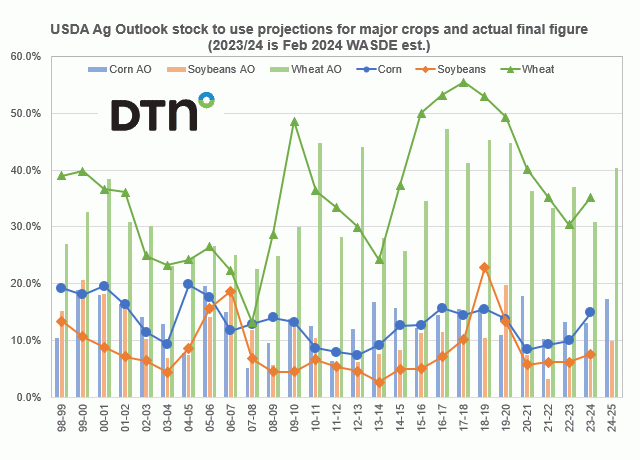
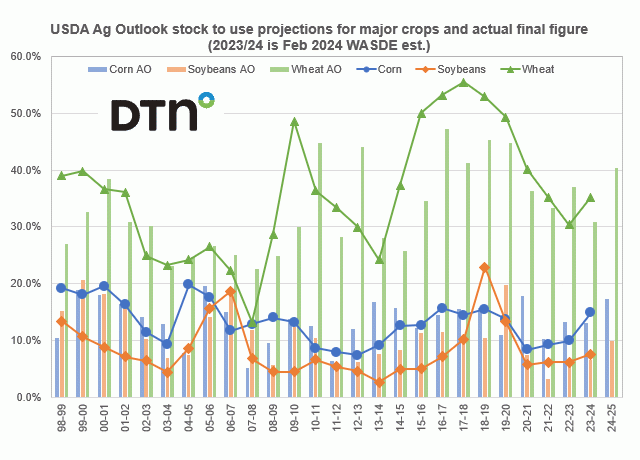
This chart shows the USDA Ag Outlook (AO) projections for the stocks-to-use ratio from 1998 to last week's 2024 projections along with the actual final figures with the 2023/24 figures based on this month's USDA WASDE estimates.
Starting with corn USDA looking for ending stocks at 2.532 bb, the largest figure since the 1987/88 season, and with total usage pegged at 14.705 bb would result in a stocks-to-use ratio of 17.2%, the heftiest since the 2005/06 marketing year.
USDA is projecting soybean ending stocks at 435 mb which would be the largest figure since the 2019/20 season, and with total usage pegged at 4.40 bb, would result in a stocks-to-use ratio of 9.5%, the loftiest figure also since the 2019/20 season.
Finally, USDA is looking for wheat ending stocks at 769 mb, which would be the largest figure since the 2020/21 season, and with total usage pegged at 1.909 bb would result in a stocks-to-use ratio of 40.3%, the loftiest figure since the 2019/20 season.
A final note in attesting to weakness in old crop values is current stocks-to-use ratios for this year at 14.9% for corn, 7.5% for soybeans and 35.2% for wheat, all above February 2023 Ag Outlook projections at 13.0%, 6.5% and 30.9% respectively.
(c) Copyright 2024 DTN, LLC. All rights reserved.


Comments
To comment, please Log In or Join our Community .