Fundamentally Speaking
Scouts See Better Crop Potential in Eastern vs. Western Leg of Tour
As we have mentioned a number of times, this growing season it appears that the states more east and south had better weather the past few weeks with regard to both temperatures and precipitation, resulting in higher corn and soybean yield potential.
Such were the comments from last week's Pro-Farmer Tour participants as those scouts in the eastern leg of the tour saw better crops in general in Ohio, Indiana and Illinois as opposed to those on the western leg who trooped through Nebraska, Minnesota and Iowa.
Notes from tour participants indicated that the Iowa corn crop suffered greatly from last week's heat after that crop and soybeans had already endured quite a bit of stress from dryness and large areas of drought.
As a consequence, both plants are already shutting down with corn ears hanging and soybean fields already starting to turn color.
In Indiana it was noted that both the corn and soybeans are a little immature and will need some more time to fully develop.
This could be linked to a summer of below average temperatures in much of the Eastern Corn Belt with rainfall seen as adequate.
P[L1] D[0x0] M[300x250] OOP[F] ADUNIT[] T[]
Scouts indicated that the Indiana corn crop has record yield potential while soybean plants had plenty of pods.
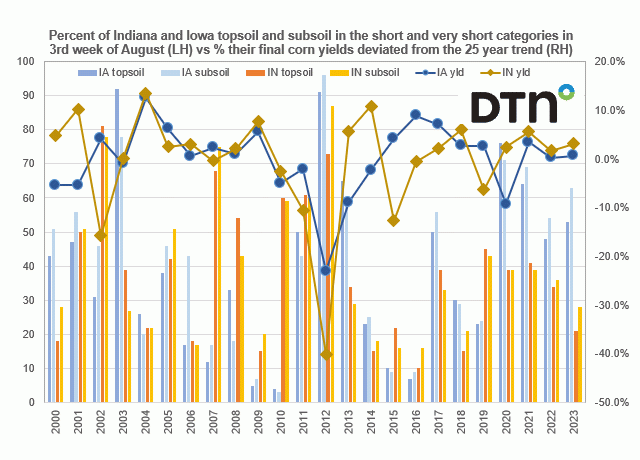
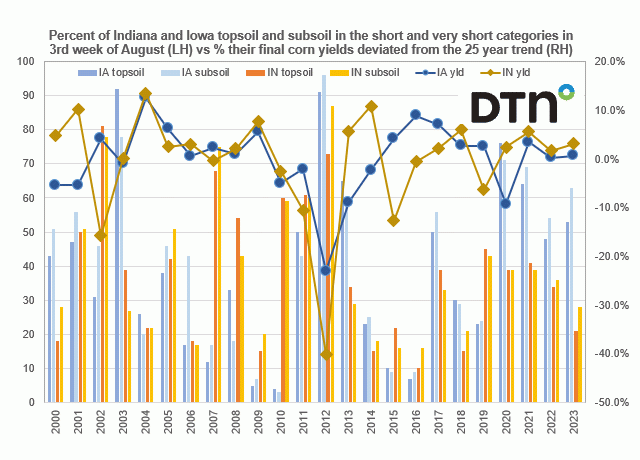
We single these two states out as this chart shows the percent of Indiana and Iowa topsoil and subsoil in the combined short and very short categories in third week of August on the left-hand axis while the percent that their final corn yields deviated from the 25-year trend is plotted on the right-hand axis.
We were going to use Iowa and Illinois, but IL does not have subsoil moisture data going back to 2000 as IA and IN do.
Perhaps there are other variables that do a better job of explaining yield variability such as crop ratings as of the third week of August or actual temperature, precipitation and drought data as we have done in the past.
Still there is a loose relation as correlation to percent yield deviation vs. topsoil and subsoil moisture shortages are -57.7% and -57.2% for Iowa respectively and -59.1% and -63.5% respectively for Indiana.
This year's Iowa topsoil short or very short at 53% is the third highest since 2013 and subsoil short or very short at 63% is the third highest since 2012.
On the other hand, Indiana at 21% short or very short for topsoil and 28% for subsoil are both the lowest since 2018.
As a final note, the Pro-Farmer tour pegged the Iowa yield at 197 bushels per acre (bpa) vs. USDA at 203 bpd, and their trend yield this year is seen at 202. (Editor's Note, the DTN Digital Yield Tour on August 9 put Iowa yields at 202.)
It appears that given current conditions, the Pro-Farmer projection seems closer to the mark.
As for Indiana, the Pro-Farmer tour pegged the yield at 194 bpa which is very close to the USDA estimate of 195, and their trend yield this year is seen at 191. (Editor's Note, the DTN Digital Yield Tour on August 8 put Indiana yields at 193.7.)
It does seem that IN is on track for an above trend corn yield this season.
(Editor's Note: For more on the DTN Digital Yield Tour, powered by Gro Intelligence, see our Spotlights page here: https://spotlights.dtnpf.com/…
(c) Copyright 2023 DTN, LLC. All rights reserved.


Comments
To comment, please Log In or Join our Community .