Fundamentally Speaking
Percent of Corn, Soybeans and Spring Wheat in Drought
The latest Drought Monitor actually shows some pretty good improvement over the Corn Belt though the drought reduction seen over the past three weeks could be arrested and even reversed given the hotter and drier weather now being forecast.
It should be noted however, the percent of U.S. corn area in drought shrunk by 9% this past week to 55%, for soybeans it is down 7% to 50%, though the spring wheat area in D1 to D4 drought did rise by 1% to now 31% of the producing area.
P[L1] D[0x0] M[300x250] OOP[F] ADUNIT[] T[]
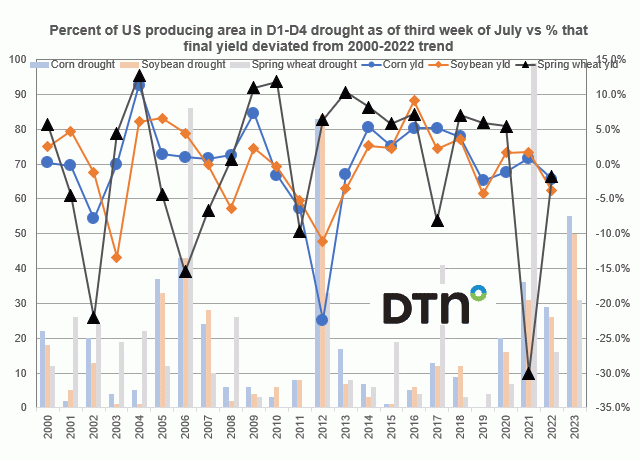
This chart shows the percent of the U.S. corn, soybean and spring wheat producing area in D1-D4 drought as of third week of July on the left-hand axis while the percent that the final yield of each of these crops deviated from the 2000-2022 trend is reported on the right-hand axis.
Note that D1 is moderate drought, D2 is severe drought, D3 is extreme drought and D4 is exceptional drought.
Despite the past week's improvement, the current corn and soybean combined D1-D4 drought ratings are the highest for the third week of July since 2012's 83% figure for corn and 84% for soybeans that resulted in final corn yields coming in 22.4% below the 2000-2022 trend and beans off by 11.1%.
The Drought Monitor began in 2000 and the only other year that had a high degree of row crop acreage in drought was in 2006 when both corn and soybeans had 43% of their producing area in drought yet final corn yields that season were close to trend and beans 4.4% above that.
The percent of the U.S. spring wheat area in drought as opposed to corn and beans has pushed higher in recent weeks but the current 31% in D1-D4 drought is well below just two years ago when 99% of the area was in some form of drought with final yields over 30% below trend, and in 2006 at 86% in drought with final yields that season 15.5% below trend.
Spring wheat is closest to being harvested so it is not surprising that the correlation between the third week of July percent in drought and the degree to which final yields deviate from trend is the highest at 70.6%, followed by corn at 65.8% but soybeans, known as a crop of August, has a relatively low correlation rate of 19.0%.
(c) Copyright 2023 DTN, LLC. All rights reserved.


Comments
To comment, please Log In or Join our Community .