Fundamentally Speaking
Most Top Corn, Soybean States Well Below Normal
For a large part of the Corn Belt, the summer (June-August) of 2022 featured generally warmer than normal temperatures and below average rainfall, not the best combination for achieving above or even trend corn and soybean yields as evidenced by the updated USDA yield reports.
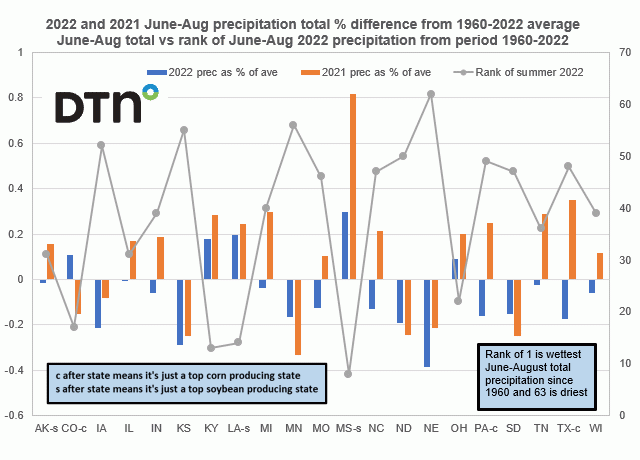
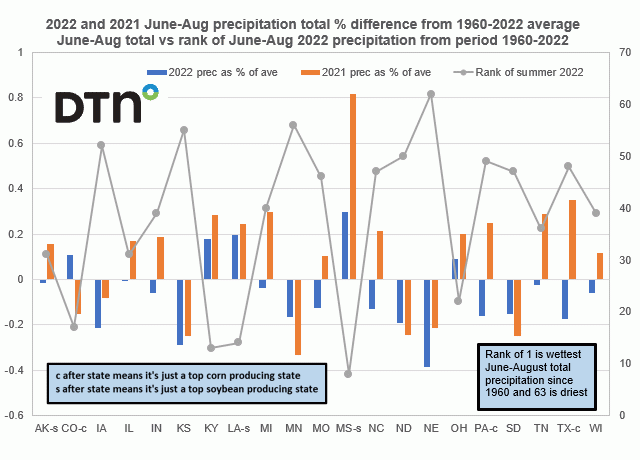
This graphic shows the percent that June-August 2022 total precipitation in inches deviated from the June-Aug 1960-2022 average for the top corn and soybean growing states on the left-hand axis.
P[L1] D[0x0] M[300x250] OOP[F] ADUNIT[] T[]
The rank of where the 2022 June-August precipitation stacks up in the period 1960 to 2022 is plotted on the right-hand axis where a rank of 1 is the wettest June-August total precipitation since 1960 and 63 is the driest June-August period.
As for summer rainfall, total June-Aug 2022 precipitation in NE lagged the most, down 38.8% from the 1960-2022 average with KS down 29.0%, SD 25.1% lower and seeing that IA down 21.6% and TX off 17.6% from its average were also quite dry.
Interesting to note that though June-August rainfall this year was higher than 2021 summer precipitation in MN, ND, and SD all three still were drier than normal at down 16.6%, 19.1% and 15.1% respectively from their average summer precipitation.
Only five of the top 21 corn and soybean growing states saw summer rainfall even above average with just one Corn Belt state which is Ohio.
As for rankings, NE is seeing its second lowest amount of June-August rainfall since 1960 with IA, PA, TX, KS, and MN also not faring well in that regard.
(c) Copyright 2022 DTN, LLC. All rights reserved.


Comments
To comment, please Log In or Join our Community .