Fundamentally Speaking
USDA Confirms 2022 Corn Yield Below Year Ago
Expectations were that Friday's USDA crop production report would show 2022 U.S. corn and soybean yields and production down from what had been projected last month.
Note that USDA in the August figures does not use actual field measurements as that starts in September, but rather relies on updated crop conditions (which have declined quite a bit in corn and beans over the past six weeks), satellite imagery and farmer assessments.
P[L1] D[0x0] M[300x250] OOP[F] ADUNIT[] T[]
For corn, USDA cut the yield cut from 177 bushels per acre (bpa) to 175.4 bpa vs. trade estimate of 175.9 bpa, with 100,000 drop in planted and harvested acreage production now at 14.359 billion bushels, off 146 million bushels from last month.
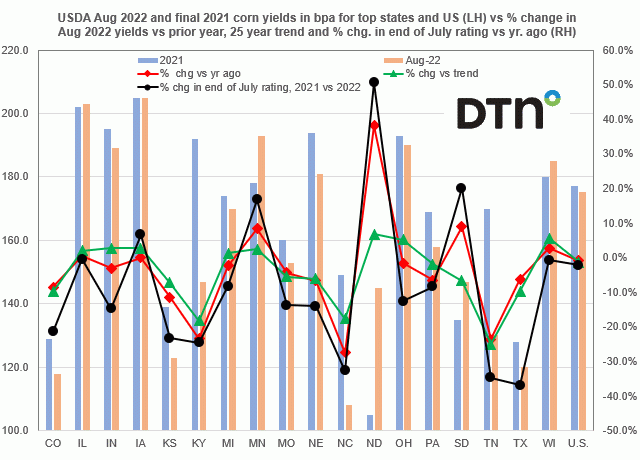
This chart shows the USDA August 2022 and final 2021 corn yields for the top 18 producing states and the U.S. in bushels per acre on the left-hand axis while reported on the right-hand axis is the percent change in the August 2022 corn yield vs. the year ago figure, the 25-year trend and the percent that end of July crop ratings differ from the end of July 2021 rating.
We start off by noting that the August yield is still above last year's August 2021 USDA projection of 174.9 bpa even though 12 of the 18 states have yields below the year ago levels and 10 of the 18 have yields below their 25-year trend.
It is states in the Plains and the south that have really suffered this year vs. the situation a year ago when severe drought up north resulted in poor yielding crops in the Dakotas and Minnesota.
CO, KS and TX are all down vs year ago and trend, while the worst performing states, being KY and TN, have yields well below last year and trend.
On the other hand, a big rebound is seen in ND while core Midwest "I" states of IA, IL and IN are doing rather well, though record yield in Iowa was projected at 205 bpa, one of only two states seeing an all-time high (along with WI) looks rather suspect given the very dry conditions seen in much of the Hawkeye state over the past month.
Finally, the fact that crop ratings used in calculating August yield are born out by the correlation between percent change in yields and end of July crop ratings vs. year ago levels a very high 91.5%.
(c) Copyright 2022 DTN, LLC. All rights reserved.


Comments
To comment, please Log In or Join our Community .