
Fundamentally Speaking
Poor Cotton, Sorghum Crops Point to Subpar Corn, Beans
Expectations for the weekly USDA corn and soybean crop ratings were for a slight deterioration but some feel last week's heat and absence of rains until this past weekend could have resulted in combined good to excellent ratings declining by 2-4%.
We were in this camp given that the prior week when weather was far better with some areas getting decent rains corn ratings held steady at 64% while bean conditions receded by 2% to 61%.
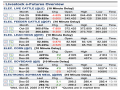
Last week, growing conditions were far worse and as a consequence, weekly condition ratings for corn, soybeans and spring wheat on Monday fell more than most analysts expected after sweltering heat across the U.S. Midwest and Plains.
To be truthful, a number of other crops saw deterioration over the past week with cotton good to excellent off 4% to a now dismal 34% and sorghum down 5% to 30% as these two crops are grown extensively through the central and Southern Plains.
P[L1] D[0x0] M[300x250] OOP[F] ADUNIT[] T[]
These abysmal ratings attest to the horrible weather this part of the country has had now for months with record high temperatures, especially in TX, and severe drought and this impacting the row crops grown in that section of the country.
Along these lines using our usual ratings system where we weight the crop based on the percent in each category and assign that category a factor of 2 for very poor, 4 for poor, 6 for fair, 8 for good, and 10 for excellent and then sum the results this chart shows the week 29 or around the fourth week of July crop ratings for the US corn and sorghum crops on the left hand axis vs the percent that their final yield deviates from the 1990-2021 trend on the right hand axis.
This year's week 29 U.S. cotton rating of 588 is tied with 1998 as the second worst since 1990 with the 2011 reading of 538 the worst.
U.S. cotton yields that year were surprisingly just 1.9% below trend that season but 9.6% below trend in 1998 as correlation between week 29 cotton ratings and percent final yield deviated from trend at a very low 5.1%.
On the other hand, correlation between week 29 U.S. sorghum ratings and percent final yield deviated from trend is a very high 81.2%.
This year's week 29 U.S. sorghum rating is also 588 which is the fourth lowest since 1990 with a 554 reading in 2012 with final yields that season 26.1% below trend, the prior year of 2011 at 548 which is the lowest rated year since 1990 when final yields were 19.3% below trend and in 2002 at 576 with the yield that season 21.8% below trend.
None of this can be good for row crop yields in some of the top corn and soybean producing states as TX cotton crop at 40% in poor or very poor condition and that in TN at 42% poor or very poor.
The sorghum state of KS having just 31% in good or excellent condition and TX a combined 22% in top two categories and seeing that for soybeans TN and MS among worst rated states and KS, TN and TX the worst rated corn states of the top 18.
(c) Copyright 2022 DTN, LLC. All rights reserved.


Comments
To comment, please Log In or Join our Community .