Fundamentally Speaking
Slowest Corn Planting Pace Ever For Dakotas, Minnesota
We thought that the CME markets would have a more positive reaction to the weekly USDA crop progress and condition report figures on Monday afternoon showing spring wheat and row crop plantings are less advanced than had been anticipated.
Part of this tied to weather forecasts showing warmer and drier forecasts for the Midwest but soybean and spring wheat seedings are so delayed that one would expect at least some depressing impact on both planted and harvested acreage and yields.
This is particularly true in the Dakotas and Minnesota where a year after severe drought conditions led to a fast rate of plantings, a series of storms with blizzards and freezing temperatures this spring has set progress way back.
It is no small consideration in that these three states now account for 20% of US corn acreage and 25% of soybeans and are among the first of the states to have the earliest prevented planting dates while other crops such as barley, oats, and sugar beets seeded in that region of the country also being adversely impacted.
Nationally as of May 1, corn plantings increased just 7% to 14% vs 42% last year and the 33% five-year average and since national ratings started in 1986 only three times has corn planting progress been slower including 1993, 1995 and 2013 with yields those seasons well below trend.
P[L1] D[0x0] M[300x250] OOP[F] ADUNIT[] T[]
In a prior post we noted that the three big I states of IA, IL and IN were well behind and that continued this past week.
Now we focus on MN, ND, and SD where the first two have no corn at all in the ground vs. their respective five-year averages are 28% and 5%, while South Dakota has 3% seeded vs the 13% average, so collectively all three have just 3% of their intended corn area planted vs the normal combined 46%.
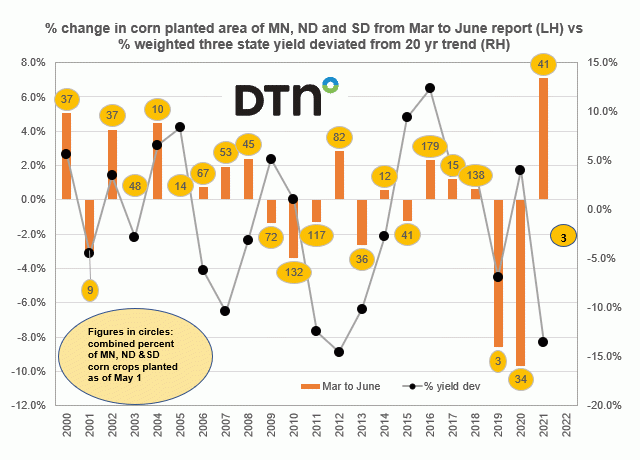
This graphic shows the percent change in the combined corn planted area of MN, ND, and SD from the end of March intentions report to the end of June Acreage figures on the left-hand axis vs. the percent that the production weighted corn yield of those three states deviated from the 20-year trend on the right-hand axis.
The figures in the circles are the combined percent of Minnesota, North Dakota and South Dakota corn crops planted as of May 1.
With data going back to 2000, this year's 3% planted rate for those three states is tied with 2019 for the least amount of corn in the ground by May 1 with the 9% figure in 2001 being the only other year where combined plantings were under double digits.
It is thought that a delayed pace of corn plantings would limit any increase in corn planted area from the March to June report and in years of big lags could result in corn area decreasing, while late corn plantings are often associated with below trend yields since the critical pollination period is pushed from the end of June-early July to the end of July when statistically it is hotter and can result in some of the corn not mature by the time the first fall freezes arrive in the Midwest, particularly in the northern regions.
In 2019 it turned out that the drop in planted area was 1.550 million acres or 8.6% as that season saw a very wet spring up in MN and the Dakotas as was the case the following year when planted acreage from the March intentions to the June report fell by an even greater 1.70 million acres, or 9.7%, while in 2001 planted area fell by 3.0%.
In both 2019 and 2001 the late plantings also contributed to below trend yields though that was not the case in 2020.
The largest negative yield deviations came in severe drought years seen a year ago and also in 2012.
While drought no longer seems an issue, the opposite problem of saturated cold soils could result in lower final corn planted area and below trend yields for all three states unless we have an exceptional rest of the growing season.
(c) Copyright 2022 DTN, LLC. All rights reserved.


Comments
To comment, please Log In or Join our Community .