

Fundamentally Speaking
USDA to Project 2022 Major Crop Acreage at Outlook Forum
This week the USDA will host its annual Ag Outlook Forum virtually for the second year in a row.
The trade is looking forward to Thursday's acreage estimate release and then the full balance sheets for the 2022/23 season on Friday.
As we are now in mid-February, attention will soon turn to spring plantings and if we are to turn the tide against rising feed prices, not only will values have to rise to levels that stifle demand but spur a large increase in planted acreage throughout the northern hemisphere.
The USDA did release some acreage estimates last fall but that was prior to the surge in prices seen since then due to the sharp deterioration in South American row crop prospects.
P[L1] D[0x0] M[300x250] OOP[F] ADUNIT[] T[]
Ahead of this week's sessions we are seeing trade estimates for corn planted area at 91.6 million acres with production at 15.021 billion bushels (bb) and ending stocks at 1.577 bb, while bean acreage is seen at 89.5 million acres with output at 4.570 bb and carryout next year at 365 million bushels.
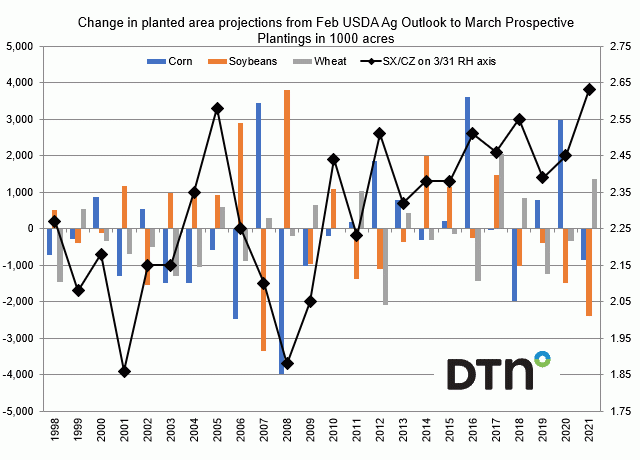
This graphic shows the change in planted area from the projections given at the USDA's February Outlook sessions to what figures are released in the end of March intentions report in 1000 acres.
We have 24 years' worth of data and the average change in corn planted area from the February Outlook projections to the prospective planting figures is down 59,000 acres while bean area averages an 85,000-acre increase and wheat averages a 174,000-acre decline.
Corn shows the largest volatility based on both standard deviation and coefficient of variance figures and wheat the least which is not surprising as USDA does have the January winter wheat seedings report to work with.
Besides the wheat seedings report, USDA also considers a number of factors to decide what planted acreage of the various crops will be.
Chief Economist Seth Meyer has already said this year will be very interesting in terms of the outlook for acreage for the coming year, specifically with regard to rising relative input costs and is the increase in perhaps fertilizer expenditures shifting acreage between corn and beans?
One factor often considered in this calculus is the new crop soybean-corn ratio which is the November soybeans price divided by the December corn futures price on or around the end of March when the intentions report is released.
We find it interesting that at the end of March last year, the SX2021/CZ2021 ratio was an eye-popping 2.63 which as the chart shows is the highest ratio ever which would appear to be in favor of more soybean acreage, but the March 2021 prospective plantings report showed soybean area down 2.40 million acres from what was projected at the February 2021 USDA Ag Outlook Forum, the second largest decline ever next to 2007.
There are a lot of questions regarding the forthrightness of respondents with the intentions report, but from Jan 1 to Mar 31, 2021, the SX/CZ ratio averaged a stout 2.59 so again it was surprising that bean area wasn't higher.
The trade was also taken aback by the small but still sizable 856,000 decline in corn area between the Feb Outlook projection and the intentions report figure.
(c) Copyright 2022 DTN, LLC. All rights reserved.

Comments
To comment, please Log In or Join our Community .