Fundamentally Speaking
2022 February Insurance Guarantee for Corn, Soybeans
Last week marked the start of calculating insurance guarantees for new crop corn and soybean prices using the average February values of November 2022 soybeans and December 2022 corn.
Even with the largest soybean crop ever last year with the second highest yield on record and the second largest corn production with an all-time high yield established, ending stocks of both are still historically tight.
Now with Argentina, Brazil and Paraguay having lost millions of tonnes of corn and particularly soybeans, some of their foregone export potential will be made up by the U.S. but not all as the function of market now is to move high enough to choke off demand and send a signal to U.S. farmers to plant an enormous amount of each crop.
P[L1] D[0x0] M[300x250] OOP[F] ADUNIT[] T[]
Complicating matters is the surge in production expenses, especially fertilizers, and this very well could favor the seeding of a less expensive crop to plant such as soybeans over corn.
Another consideration is there are a variety of crops that are seeing their highest prices in years such as wheat, milo, oats, and barley among others all laying out their claim in the upcoming "acreage battle".
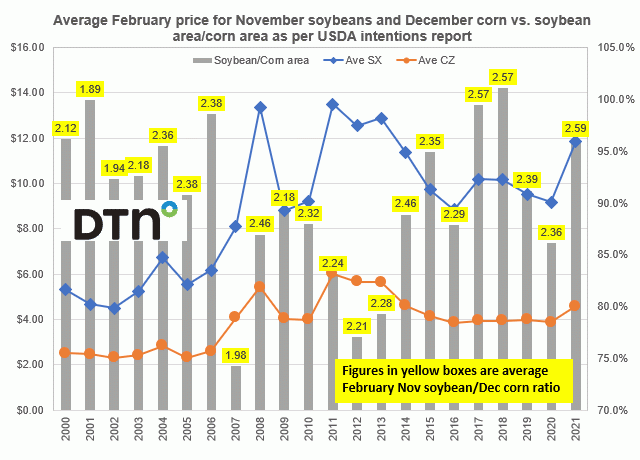
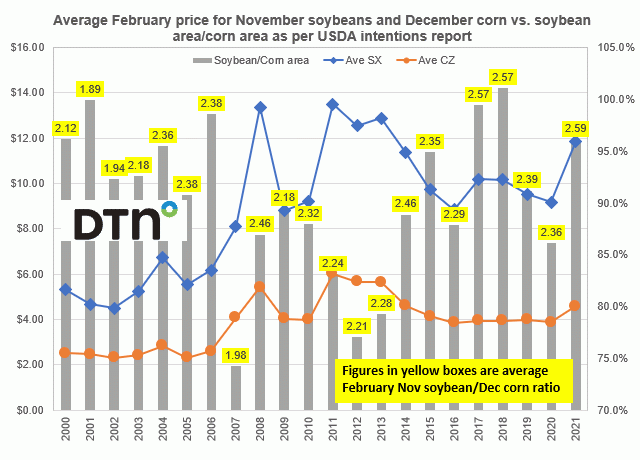
This chart shows the average February price for November soybeans and December corn in $/bushel on the left-hand axis vs. the percent soybean acreage is of corn as given by the USDA's March planting intentions figures on the right-hand axis.
The yellow boxes show the average SX/CZ ratio for the month of February.
We do not know what the average February price for corn and soybeans this year will be yet but the current prices of $5.82 for December 2022 corn is the second highest ever next to the average $6.01 seen in February 2011, while the current price of November 2022 soybeans at $14.13 if maintained would be the highest ever for the February calculation for new crop soybeans.
As noted in the graphic, the figures in the yellow boxes are the average February Nov soybean/Dec corn ratios and this year's current ratio of 2.42 is seen above the average 2.35 where bean seedings are favored vs. corn and when the ratio is below that corn is seen as the more attractive crop to plant.
Last year's average February SX/CZ ratio came in at 2.59, the highest ever and was one of the reasons why the March 2021 USDA prospective plantings figure for soybeans was a rather high 96.1% of the 2021 corn intentions figure compared to the 2000-2021 average of 90.4%.
Other years of high SX/CZ ratios such as the back-to-back years in 2017 and 2018 when the ratio was 2.57 resulted in planted area ratios of 99.4% and 101.1% respectively.
(c) Copyright 2022 DTN, LLC. All rights reserved.


Comments
To comment, please Log In or Join our Community .