Fundamentally Speaking
US Soybean Oil Export & Shipment Pace
Quite a change in the dynamics of US soybean oil demand as back in the 2000/01 marketing year, total exports were 1.14 million metric tons (mmt) while for the 2021/22 season, as per this month's WASDE export projection, they are forecast at a mere 646,000 tonnes which would be the lowest figure since the 2005/06 marketing year.
On the other hand, back in the 2000/01 season, soybean oil used for biodiesel purposes were negligible and today they are forecast at a record 5.0 mmt, a huge 25% jump just from the year ago level.
With all the hoopla about the huge forecasted future demand for vegetable oils to be used in the renewable biodiesel industry, not much is being reported about our overseas sales efforts.
P[L1] D[0x0] M[300x250] OOP[F] ADUNIT[] T[]
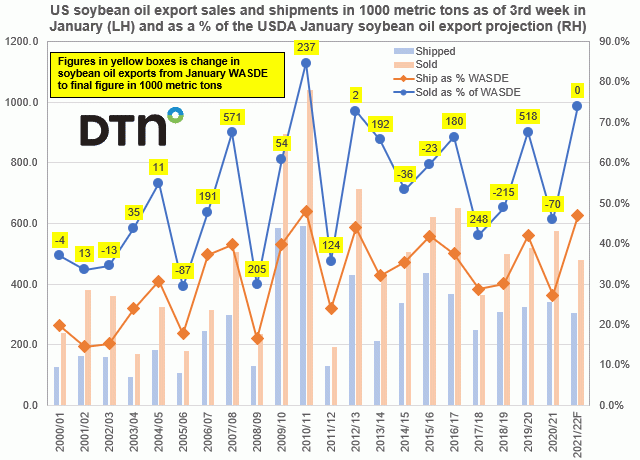
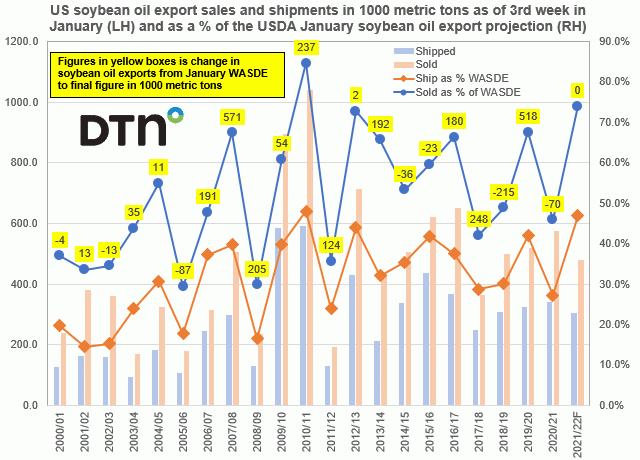
However, as seen on this chart, which shows U.S. soybean oil export sales and shipments in 1000 metric tons (mt) as of the third week in January on the left-hand axis and as a percent of the USDA's January soybean oil export projection on the right-hand axis, the current sales and shipment pace is so strong that an upward revision in our soybean oil exports, perhaps a sizable one, is quite likely.
Though the current export figure as of the third week of January is a mere 481,000 mt, the third lowest for this point in the marketing year since the 2008/09 season, it is actually 74% of the January 2022 WASDE export projection which, other than the 84.6% figure seen back in the 2010/11 season, appears to be the second highest percent at least since 2000.
We have also shipped 305,000 tonnes of that which is 46.8% of the WASDE projection and is the highest ever, even topping the figure from that 2010/11 season.
With sales and shipments this robust this early in the year and given large soybean output reductions being seen for Argentina, the world's largest soybean oil exports the prospects for even higher sales look promising.
In this regard, the figures in the yellow boxes are the change in soybean oil exports from the January WASDE report to the final figure in 1000 mt.
In other years where the early season sales pace has been strong such as that 2010/11 season or 2007/08 and 2019/20, U.S. soybean oil exports have been adjusted up by large margins.
(c) Copyright 2022 DTN, LLC. All rights reserved.


Comments
To comment, please Log In or Join our Community .