Fundamentally Speaking
Bean Oil Strongest Member of Soybean Complex
We have seen a correction in the long oil/short meal share of the combined soybean crush margins as cash soybean oil basis in central Illinois just a few weeks ago hit its highest percent of the soybean crush value ever at close to 53% vs the long-term average of 33%.
Yet in looking at the whole oilseeds complex, including oilseeds themselves, along with the protein meal and vegetable oils situation it is soybean oil along with other vegetable oils that still has the tightest stocks-to-use ratios.
The world vegetable oil stocks-to-use ratio is composed of cottonseed, olive, palm, palm kernel, peanut, rapeseed, soybean, and sunflower seed oils.
P[L1] D[0x0] M[300x250] OOP[F] ADUNIT[] T[]
What is different here as opposed to the world oilseed or global protein meal situation is that soybean oil is not the dominant vegetable oil produced.
That is palm oil, which accounts for 36% of world vegetable oil output, with soybean oil coming in second at 29% with rapeseed or canola oil at 13% and sunflower oil at 9%.
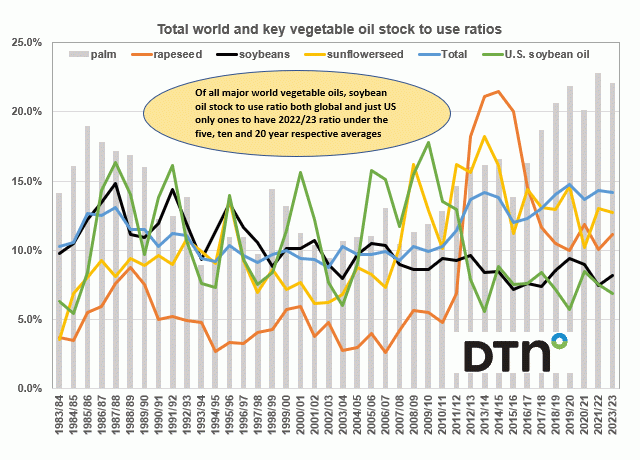
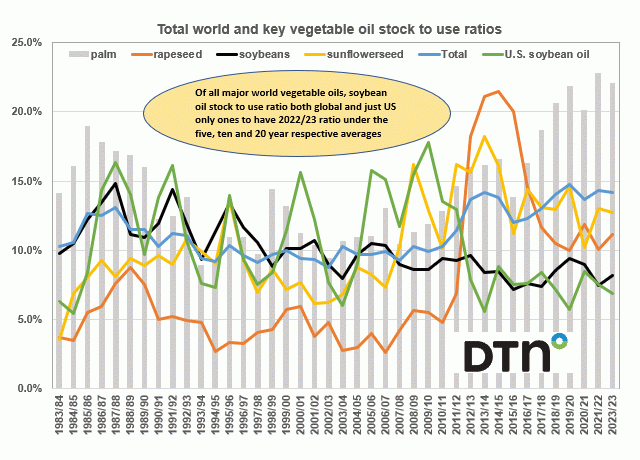
This graphic shows the total world vegetable oil stocks-to-use ratio since the 1983/84 season and also has the stocks-to-use ratio of palm, soybean, rapeseed, sunflower oils.
This year's global vegetable oil stocks-to-use ratio at 11.34% is the lowest since the 2010/11 season and 1% above the 22-year average of 11.2%.
Just world soybean oil stocks-to-use at 6.6% is the lowest since at least the 2000/01 season and a huge 24.4% below the 22-year average of 8.73%.
While the world oilseeds situation is still historically tight, for the vegetable oil markets it is even tighter and for soybean oil the tightest ever which should continue to support both the flat price of bean oil and should maintain a historically high proportion of the combined soybean crush margin.
(c) Copyright 2021 DTN, LLC. All rights reserved.


Comments
To comment, please Log In or Join our Community .