Fundamentally Speaking
World Wheat Yields Deviation From Trend
U.S. and global wheat prices are at their highest levels in years amid depleted carry-in stocks, increased usage in feed rations and production shortfalls in many of the world's largest producing regions and countries.
As in the U.S., foreign planted and wheat harvested acreage has trended down over the past 30 years for a variety of reasons so the only way to meet the annual increase in global demand, which for this commodity is linked more to population as opposed to income growth, is via higher yields.
P[L1] D[0x0] M[300x250] OOP[F] ADUNIT[] T[]
Unfortunately, Mother Nature has not been too kind to the planet's wheat crops in recent years with world wheat yields below their long-term trend three of the past four seasons.
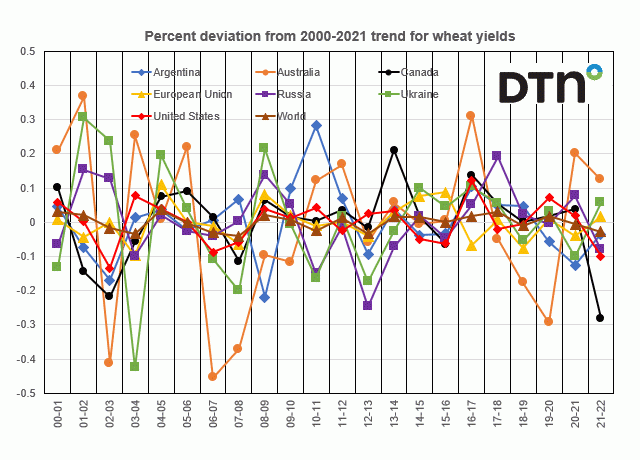
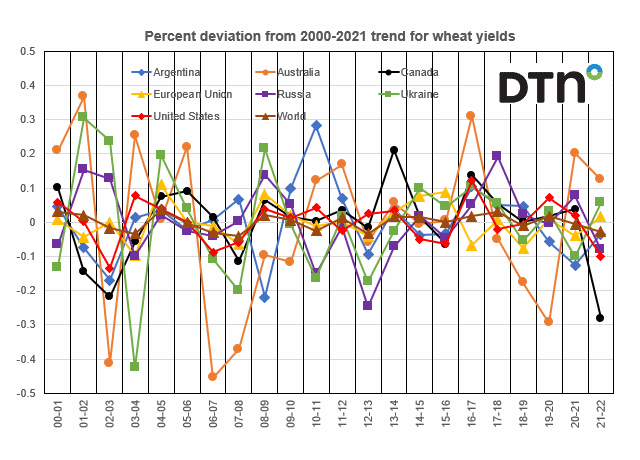
This graphic shows the percent deviation from the 2000-2021 trend for wheat yields for the world and then for each of the seven major wheat exporters whose collective stocks-to-use ratio is at its lowest levels in 14 seasons. They include Argentina, Australia, Canada, European Union, Russia, Ukraine, and the U.S.
For this year, the world wheat yield at 3.47 metric tons per hectare is 2.7% below trend, the largest negative deviation since the 2012/13 season and the second largest since the 2007/08 marketing year.
Contributing to this were horrific growing conditions this past season in North America as both the U.S. and Canada had severe drought in their spring and durum wheat growing regions with winter varieties also seeing poor results.
This year's U.S. all wheat yield at 44.3 bpa is the lowest since 2015 and at 10.0% below the 21-year trend has the largest negative deviation at least since 2000 and that also looks to be the case for Canada.
(c) Copyright 2021 DTN, LLC. All rights reserved.


Comments
To comment, please Log In or Join our Community .