Fundamentally Speaking
Corn Plantings Higher in Drought Areas
One of the more negative items from the USDA's May 2021 WASDE report was in new crop corn where projected ending stocks of 1.507 billion bushels (bb) was quite a bit higher than trade guess of 1.350 bb and suggests a more relaxed situation for the coming year.
This however is predicated on two questionable factors: whether the 179.5 bushel per acre (bpa) forecasted yield (which is almost 3 bpa above the old record last seen in 2016) will be attained or exceeded and if our corn exports will drop 325 million bushels (mb) from what is projected for this year.
We will comment on the overseas sales situation in a future post but note even with final acreage seen higher than the 91.1 million acres USDA used, much of that increase is in the Dakotas and other areas that were not able to get their corn crop planted the past two years.
This is not the highest yielding ground in the Corn Belt and is the exact part of the country that is suffering from very severe drought conditions.
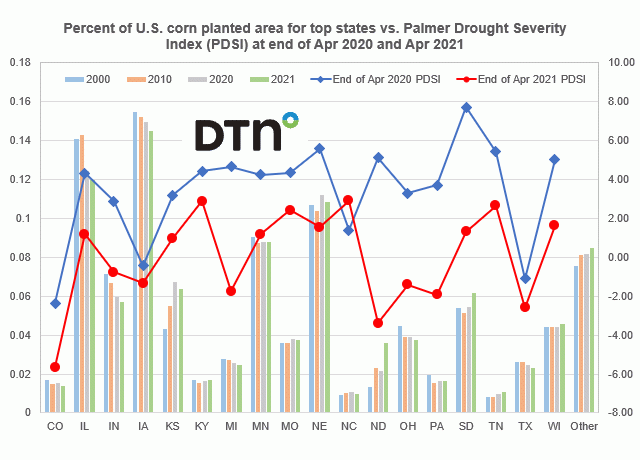
This chart shows the percent of U.S. corn planted area for each of the top 18 producing states on the left-hand axis for four time slots (2000, 2010, 2020 and the 3/31/2021 planting intention figures) while on the right-hand axis is the end of April Palmer Drought Severity Index (PDSI) for 2020 and 2021.
P[L1] D[0x0] M[300x250] OOP[F] ADUNIT[] T[]
We have noted in the past that for a variety of reasons corn and soybean acreage has increased quite dramatically in both North and South Dakota over the years and the graphic shows the Dakotas will account for almost 10% of all U.S. corn planted area this year vs. 7.6% last year and just 6.8% 20 years ago.
These two states along with TN and those states not in the top 18 referred to as others have seen their share of U.S. corn acreage increase over the years, yet they average only 80-90% of the national yield.
Interesting to note that many of the higher yielding states Midwest states such as IL, IN, IA and OH have seen their share of U.S. corn planted area go down.
The second point is that the Dakotas along with other key Corn Belt states are very dry.
The PDSI uses readily available temperature and precipitation data to estimate relative dryness.
It is a standardized index that generally spans -10 (dry) to +10 (wet) though more typically shows a range of -4 to +4.
Any reading below -2.00 is moderate drought, -3.00 or below severe drought and -4.00 or below is extreme drought.
Of the 18 states CO is in a dire situation as is much of the western U.S with a reading of -5.64, but ND in a critical situation at -3.39 with TX at -2.58, MI at -1.75 and IA, the largest corn growing state that had a myriad of problems last year coming in at -1.33.
Maybe the most noteworthy item in this graphic is only one state, North Carolina, has a higher PDSI reading now than a year ago.
Some differences are sizable especially in the Dakotas and Michigan where huge problems with excess wetness in 2020 have been replaced by big trepidation about extremely dry soil moisture conditions this spring.
(c) Copyright 2021 DTN, LLC. All rights reserved.


Comments
To comment, please Log In or Join our Community .