Fundamentally Speaking
Iowa Growing Conditions Comparison
Growing conditions for Iowa's corn crop last month were quite inhospitable to say the least. The rare "derecho" type storm and extreme drought in many areas of the state leading to widespread deterioration as indicated by the weekly USDA crop progress and condition figures.
Consider that in week 30, which was July 26th, 77% of Iowa's corn was rated either in good or excellent shape. Five weeks later, in week 35 or by August 30th, only 45% was in the top two categories.
P[L1] D[0x0] M[300x250] OOP[F] ADUNIT[] T[]
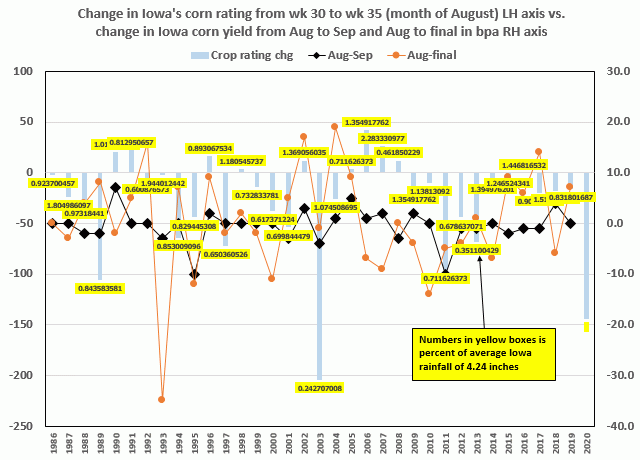
Using our usual rating system, we assign the percent of the crop in excellent condition at 10, that in good at 8, fair at 6, poor at 4 and very poor at 2 and then summing the results, this graphic shows the change in Iowa's corn rating from week 30 to week 35. This is essentially the month of August. The left axis shows the change in Iowa corn yield from August to the September report. The August to final production report given in January in bushels per acre (bpa) shows on the right axis.
Using our ratings system, Iowa's crop went down by 144 points in August, from week 30 to week 35. This is the second largest decline since 1986.
The only year worse was 2003 when it went down by 204 points. That Iowa crop was rated just 36% in good or excellent at the end of August 2003 vs. 82% in good or excellent shape five weeks earlier. Part of the reason was August 2003 brought a mere 1.03 inches of rain to the Hawkeye State, just 24% of the average 4.24 inches. The percent of each year since 1986 of average August rainfall is in the yellow boxes.
The impact on yields was not as devastating as one would have thought. Although Iowa's corn yield fell by 4 bpa from the August to the September report to 154 bpa, the final 2003 Iowa corn yield at 157 bpa. This was 1 bpa below the initial estimate despite the very dry August and was at that time the state's second highest corn yield ever.
Other years of large crop condition declines in Iowa during August include 2011's 96-point drop where the Aug to final yield change was down 5 bpa. In 1989 delined 106 points where that year August to final yields increased 8 bpa. Of note, that Iowa July rains were 4.11 inches vs. this year's 2.87. The drought monitor at end of July this year at very good at 2.21 vs. 0.77 at end of July 2003.
© (c) Copyright 2020 DTN, LLC. All rights reserved.


Comments
To comment, please Log In or Join our Community .