Fundamentally Speaking
August USDA Corn Output, Yield and Stock Figures
There is an old adage that big crops get bigger though the USDA did set the bar rather high with their 181.8 bpa 2020 U.S. corn yield estimate, a full 3% above the 30-year trend.
Now with a high degree of uncertainty as to how much grain was lost from the devastating derecho that according to reports may have impacted anywhere from 10-15 million acres of Midwest farmland, a new guessing game as to how much U.S. corn, soybean and other crops were planted in 2020.
Depending on how one interprets the first batch of prevented planting data released last week by the Farm Service Agency and a 10-12 day period of relative dryness for the Midwest, the trade is now questioning whether last Wednesday's corn output, yield and 2020/21 ending stock figures will be the highs for the year with all three coming down in subsequent production and WASDE reports.
P[L1] D[0x0] M[300x250] OOP[F] ADUNIT[] T[]
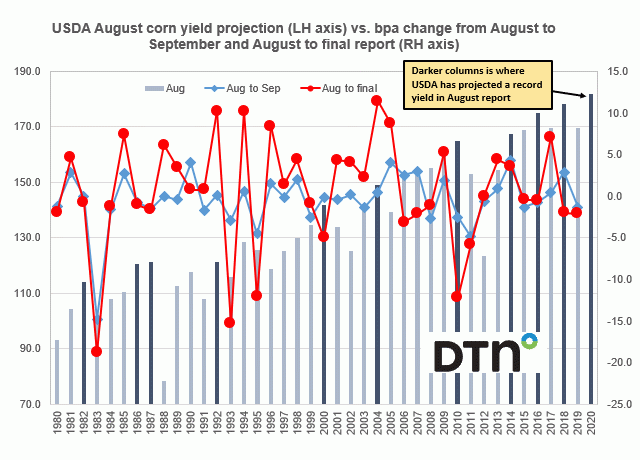
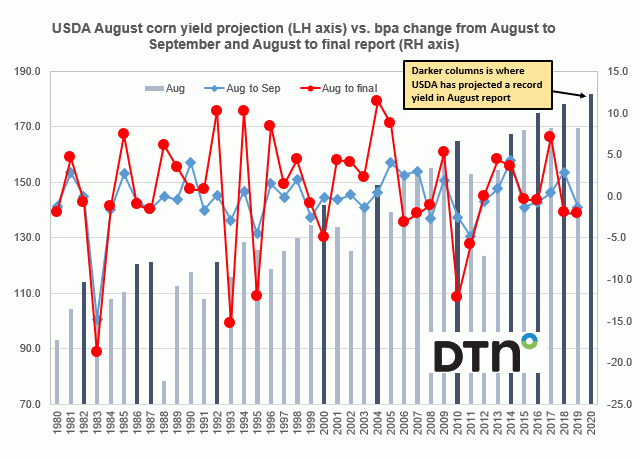
Aong these lines, this graphic shows the USDA August corn yield projection on the left-hand axis vs. the change from August to September and August to the final report on the right-hand axis, both in bushels per acre (bpa).
We have also highlighted those columns in a darker shade that have the USDA August U.S corn yield projection at a record high as is the case this year.
We have covered the period 1980-2019 and of these 40 seasons, there were 10 instances where USDA projected the new crop corn yield at a record high in its first official crop production report.
Of all the years, the average change from the August to the September report was down 0.3 bpa and the average change from the August to the final report was up 0.5 bpa.
For those ten years where USDA pegged the August yield at a record, the change to the September and final report averaged up 0.2 bpa.
Four of the past six times however when the USDA has projected a record yield, the change from that figure to the final number have fallen including a sizable 12.2 bpa plunge in 2010 and even a 2.0 bpa dip as recently as two years ago.
© (c) Copyright 2020 DTN, LLC. All rights reserved.


Comments
To comment, please Log In or Join our Community .