

Fundamentally Speaking
Relation Between Drought Stress and Protein Content in Kansas Wheat
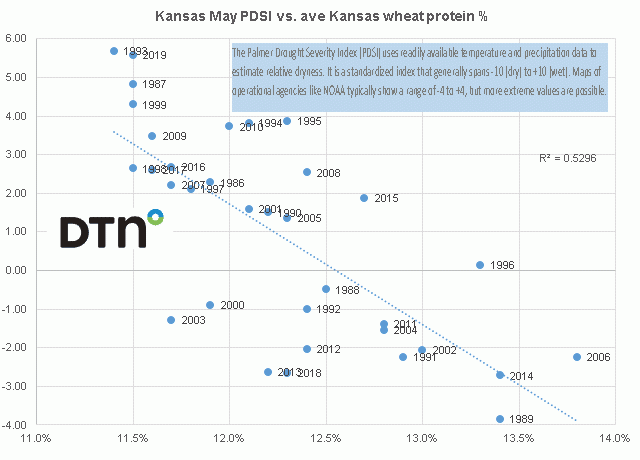
There has been talk on how low the wheat proteins have been so far in the drought areas of Kansas as there is usually some correlation between drought stress and protein levels in wheat.
In this regard, we ran some regressions using average Kansas wheat protein percent levels vs. May Kansas temperatures, May precipitation and end of May Palmer Drought Severity Index (PDSI) reading and from 1986 to 2019 and correlations were +15.8%, -22.3% and -72.8% respectively as end of May PDSI appears to have greatest impact on KS wheat protein levels.
This chart below shows the scatterplot relation with R2 of 53% indicated 53% of variability in KS wheat protein levels explained by PDSI readings.
P[L1] D[0x0] M[300x250] OOP[F] ADUNIT[] T[]
The Palmer Drought Severity Index readings are on the y-axis.
The index has proven most effective in determining long-term drought, a matter of several months, but it is not as good with conditions over a matter of weeks.
It uses zero as normal, and drought is shown in terms of negative numbers; for example, negative 2 is moderate drought, negative 3 is severe drought, and negative 4 is extreme drought.
The average Kanas wheat protein percent is plotted on the x-axis.
Note years of severe drought like 1989, 2006 and 2014 usually produce the highest protein wheat.
Conversely real wet years such as 1993 or a year ago results in lower protein wheat.
This year's end of May PDSI reading for Kansas at 3.21 implies an average protein of around 11.7%
© (c) Copyright 2020 DTN, LLC. All rights reserved.
Comments
To comment, please Log In or Join our Community .