Fundamentally Speaking
Measuring Relative Corn and Soybean Yields
There have been regional shifts where some of the major crops are grown in the U.S. over the past twenty years and we have highlighted some of these in the past.
For instance, the big ethanol boom starting in 2005 resulted in more corn seeded in areas of the Plains such as in Colorado, western Nebraska and western Kansas as the higher prices offset the lower yields produced there.
We have also seen increased soybean acreage in both the Northern Plains and Delta as higher returns for soybeans have displaced some of the traditional crops such as spring and durum wheat, cotton and peanuts.
P[L1] D[0x0] M[300x250] OOP[F] ADUNIT[] T[]
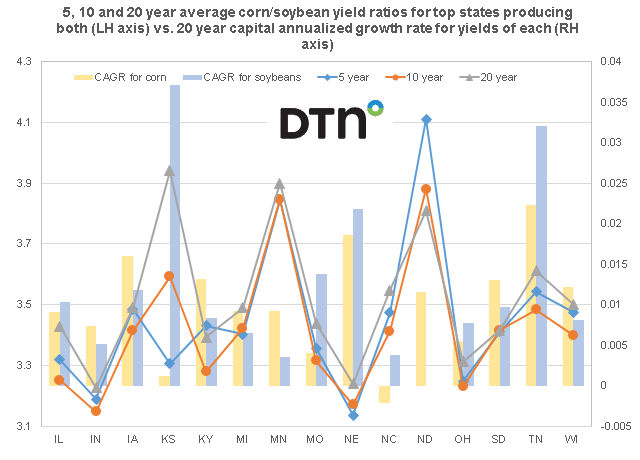
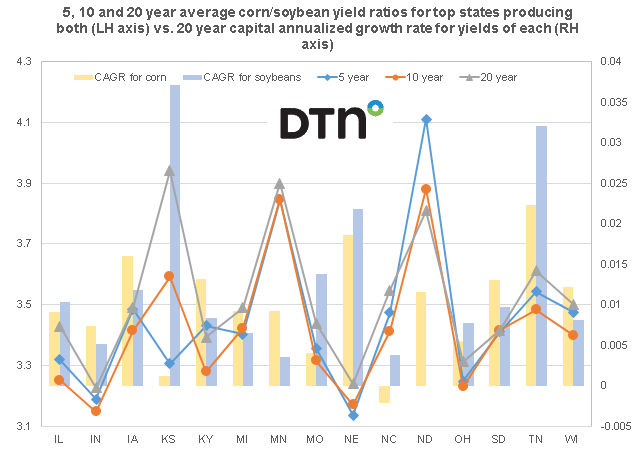
This graphic shows the average corn/soybean yield ratio for the past 5, 10 and 20 years for the 15 top producing states of both on the left hand axis.
We also show the capital annualized growth rates (CAGR) for the past 20 years for all of these 15 states for both corn and soybeans yields on the right hand axis.
For a number of the states it appears that soybean yields have increased at a faster rate over the past five years on a relative basis vs. corn than what occurred over the past 20 seasons.
This has happened in 12 of the 15 states such as in Illinois where the 20-year corn/soybean yield rate of 3.43 compares to the 5-year ratio of 3.32, meaning that bean yields have increased relative to corn yields.
Nowhere is this more so than in Kansas where the average corn/soybean yield ratio has been 3.94 since 2000 but fell to an average of 3.59 over the past ten years, then falling even more so to 3.31 over the past five seasons.
This shows that in KS soybean yields have increased at a faster rate than corn yields and this can be seen from the CAGR for soybeans where soybean yields have increased by an average of 3.72% each year since 2000 whereas the annual average increase in corn yields has only been 0.11%.
Soybean yields have really increased in Tennessee averaging an annual increase of 3.21% since 2000, though the rise in corn yields of 2.22% is also impressive.
The exact opposite situation is seen in North Dakota where the soybean CAGR since 2000 is 0% yet that for corn is 1.16% as their average corn yield has increased from 3.81 for the 20 year average to 4.11 for the past five years.
(KM)


Comments
To comment, please Log In or Join our Community .