

Fundamentally Speaking
Upper Midwest Soils Saturated
A number of comments coming out of the American Farm Bureau Federation meetings in Austin, Texas last week were that USDA still does not have a good handle on the size of the 2019 U.S. corn crop.
Recall there was over one billion bushels (bb) of corn still out in the fields when the USDA ended its weekly crop progress and condition reports the first week of December.
This was due to the latest planting pace ever for corn linked to the record spring rains, which delayed crop maturation in a number of areas.
The harvest was also drawn out due again to untimely heavy fall precipitation, both rains and snow.
Now as the 2020 spring planting season draws near, expectations are that both corn and soybean seedings will increase substantially over 2019 levels as farmers get set to plant ground that was too saturated last spring.
Or will they?
Weeks before planters roll, there is concern that prevented planting insurance claims could be as high as last year as much of the Midwest, especially northern locations, are completely saturated.
P[L1] D[0x0] M[300x250] OOP[F] ADUNIT[] T[]
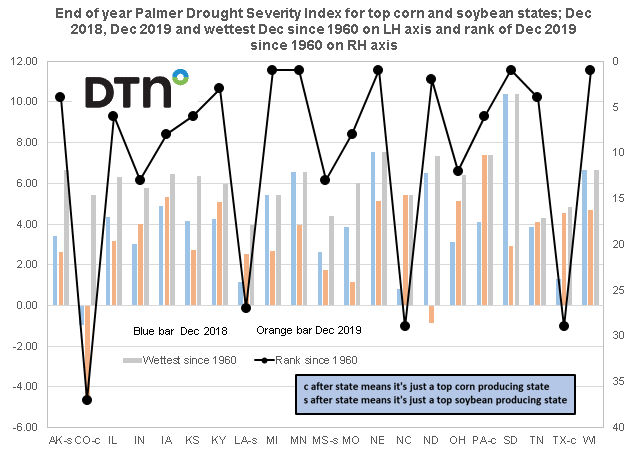
This graphic shows the end of the year Palmer Drought Severity Index (PDSI) for the top corn and soybean states as of December 2018, December 2019 and the wettest end of year PDSI as of 1960 on the left hand axis.
On the right hand axis is where December 2019 ranks for all the Decembers since 1960 with a 1 ranking meaning it is the wettest December and 60 the driest.
As noted before, the PDSI is the monthly value (index) that is generated indicating the severity of a wet or dry spell.
This index is based on the principles of a balance between moisture supply and demand.
Man-made changes were not considered in this calculation.
The index generally ranges from -6 to +6, with negative values denoting dry spells and positive values indicating wet spells.
There are a few values in the magnitude of +7 or -7.
PDSI values 0 to .5 =normal; 0.5 to 1.0 = slight wetness; 1.0 to 2.0 = mild wetness; 2.0 to 3.0 = moderate wetness; 3.0 to 4.0 = severe wetness; and greater than -4.0 = extreme wetness.
Looking at the chart, with the exception of Colorado, Louisiana, and Texas, all the other 18 states are actually beset by very sodden conditions with IL, IA, KS, KY, OH, PA and TN severely wet.
The worst states however are the northern ones of MI, MN, NE, SD and WI where their PDSI ratings as of the end of the year have never been higher.
ND is the second highest ever as they are completely drenched and unless a drying trend takes hold immediately, getting the corn, soybean and other crops seeded in that region of the country will be a real challenge.
(KLM)
© Copyright 2020 DTN/The Progressive Farmer. All rights reserved.

Comments
To comment, please Log In or Join our Community .