

Fundamentally Speaking
Tightest Annual Price Range for Soybeans Since 2001

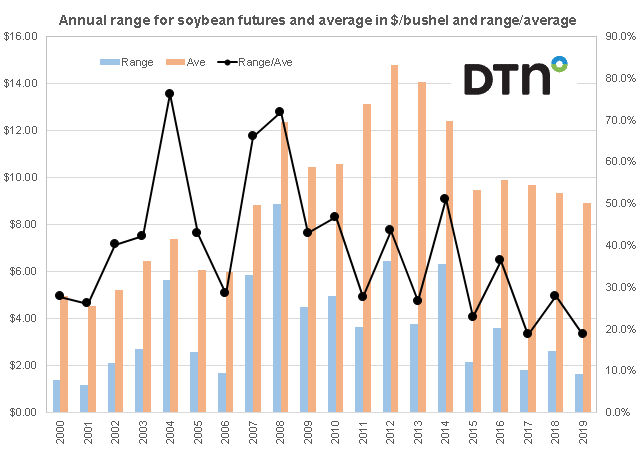
Quite a year for soybean futures given the ongoing trade wars with China that collapsed our exports along with the outbreak of African swine fever in that country that further pared demand.
It is also expected that for the second time ever, Brazil will supplant the U.S. as the world's largest producer of this oilseed.
That may explain why the average soybean futures prices for 2019 came in at $8.90 per bushel, the lowest value since the average $8.85 seen in 2007.
P[L1] D[0x0] M[300x250] OOP[F] ADUNIT[] T[]
This graphic shows the average spot soybean futures price from 2000-2019 in dollars per bushel and the annual range measuring the price difference from the year's high to the year's low on, also in dollars per bushel on the left hand axis.
On the right hand axis is a very crude measure of volatility showing the annual range divided by the annual average.
Even with a very wet spring, the lack of export demand kept a bearish influence on values all year which seemed to dampen speculative interest in this market as the annual range was a mere $1.66 from the low of $7.80 to a high of $9.46.
This is the tightest annual range for the spot soybean futures since a $1.18 range was seen in 2001 while the range over the average calculation came in at 18.7%.
Other than the 18.6% figure for 2017, this is the smallest range/average figure in at least 20 seasons.
Other notes include the high of $9.46 being the lowest peak since 2006 while the 2019 low of $7.80 is the lowest low since 2008.
(KR)
© Copyright 2020 DTN/The Progressive Farmer. All rights reserved.
Comments
To comment, please Log In or Join our Community .