
Fundamentally Speaking
Highest U.S. Spring Rainfall Ever

We knew this spring was wet but the National Oceanic and Atmospheric Administration (NOAA) in its State of the Climate report for May 2019 indicated that last month the precipitation total for the contiguous U.S. was 4.41 inches, 1.50 inches above average.
It ranked second wettest in the 125-year period of record for May as well as second wettest for all months since January 1895 trailing only the 4.44 inches in May 2015.
The spring precipitation total (March-May) was 9.85 inches, 1.91 inches above average and the sixth wettest spring on record, while the year-to-date precipitation total was 15.71 inches, 3.32 inches above average and ranked as the wettest year-to-date period for the contiguous U.S. in the 125-year record.
P[L1] D[0x0] M[300x250] OOP[F] ADUNIT[] T[]
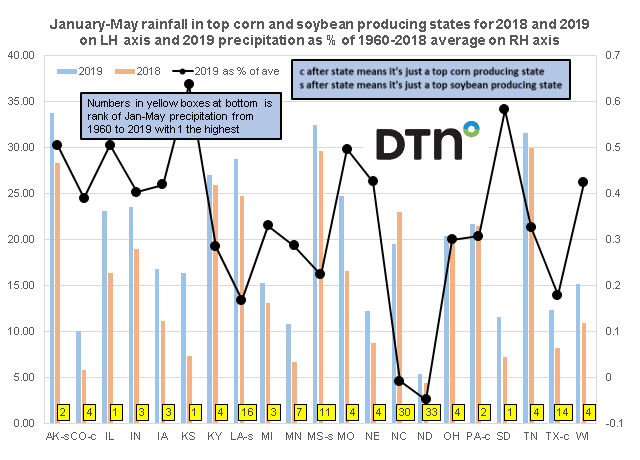
For weeks we have detailed how record rainfall in many key crop growing regions of the U.S. has prevented the timely plantings of a number of crops and the accompanying chart measures this in detail.
The graphic shows cumulative precipitation for the first five months of the year for the top 21 corn and soybean growing states with three just one of the top 18 corn or soybean states and 15 others top producers of both for both 2018 and 2019 on the left hand axis in inches.
On the right hand axis is the percent that 2019 Jan-May precipitation is above or below the average 1960-2018 Jan-May precipitation.
At the bottom of the chart is the rank of 2019 Jan-May precipitation from 1960 to 2019 with a 1 ranking meaning this was the wettest January-May period since 1960.
Start out by noting that with the exception of North Carolina, with total precipitation for the first five months of the year totaling 19.4 inches (0.8% below the 1960-2018 average of 22.9 inches) and North Dakota where Jan-May moisture was 4.9% less than average, all the other 19 states had Jan-May precipitation above the 1960-2019 average.
The hardest hit states include Arkansas at 50.3% above average, Illinois at 50.4% above average, Kansas at 65.3% above average and South Dakota at 58.1% above average.
No surprise then that Arkansas Jan-May precipitation of 33.8 inches is the second highest cumulative total for the first five months of the year since 1960 with the other three mentioned states having their highest Jan-May total at least since 1960.
(KM)
Comments
To comment, please Log In or Join our Community .