

Fundamentally Speaking
Weather Washes Out First USDA Take on 2019/20 Corn Balance Sheet
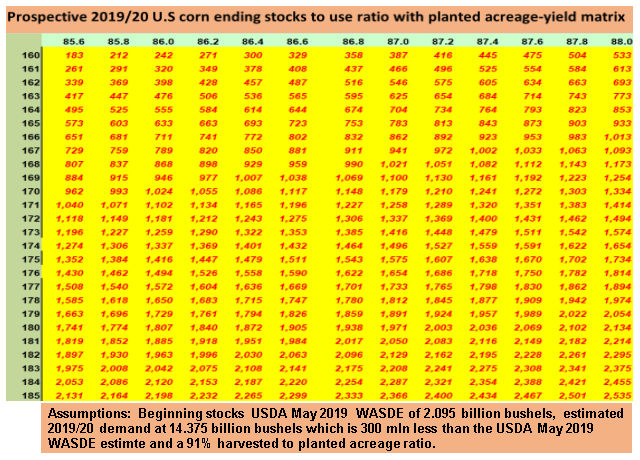
This graphic updates our 2019/20 ending stocks calculations posted before based on a matrix of planted acreage on the x-axis at the top in millions and yields going up and down the y-axis on the left in bushels per acre.
Given talk that actual corn plantings will be down at least five million acres from the 92.8 million given in the March prospective plantings report, the highest acreage number going across the top on the x-axis is 88.0 million acres and goes as low as 85.6 million acres.
We have heard that actual corn plantings may fall by as much as 10 million acres and that could put final seedings closer to 83 million.
Hopefully that does not happen, for that could push corn prices quite a bit higher, closer to the $6.00 region or more.
As for yields, we have no idea how weather in the key June-September period will turn out but one of the first variables USDA uses in its weather adjusted yield model is mid-May (May 15) planting progress with the average planting progress used for that date at 80%.
P[L1] D[0x0] M[300x250] OOP[F] ADUNIT[] T[]
According to USDA, corn plantings by mid-May are important for yield potential because that allows more stages of crop development to occur earlier, before the most severe heat of the summer.
Earlier development of the crop is also generally associated with less plant stress from moisture shortages.
With a coefficient of 0.289 for that term in the corn-yield model, 10 percent more of the corn crop planted by mid-May raises the expected corn yield by 2.89 bushels per acre.
Similarly, 10 percent less of the crop planted by the middle of May reduces the model's per-acre yield expectations by 2.89 bushels.
As of May 15 this year, 28% of the nation's crop was in the ground and that is 52% below the 80% level.
Just based on this, yields could be off as much as 15 bushels per acre (bpa) from trend (52% * 0.289 = 15).
Additional assumptions we are using is a harvested to planted ratio of 91% instead of the normal 92% as years of late plantings such as 1993, 1995, 1996, 2002 and 2008 can result in increased corn cut for silage or just abandoned.
Based on higher expected prices we are also shaving demand by 300 million bushels down to 14.375 billion, though that may be a conservative estimate.
Quite clearly however, the likelihood of much lower plantings and a good possibility of below trend yields could pare 2019/20 ending stocks to very low levels.
Note that just a 6 bpa reduction in the corn yield from the USDA projection and five million less acres gets the stock to use ratio under 10% and corn prices averaging $5.00 per bushel.
(KR)
© Copyright 2019 DTN/The Progressive Farmer. All rights reserved.

Comments
To comment, please Log In or Join our Community .