
Fundamentally Speaking
"Trend" Yield for 2019 U.S. Corn Crop

Even though 2019 corn plantings are expected to be slow through the month of April, the market so far has paid this no heed.
Strong performances in previous seasons has the trade convinced that yields have made an upward paradigm shift regardless of when the crop gets in the ground.
Given that backdrop, this post looks at what the prospective U.S. corn yield could be for this season.
P[L1] D[0x0] M[300x250] OOP[F] ADUNIT[] T[]
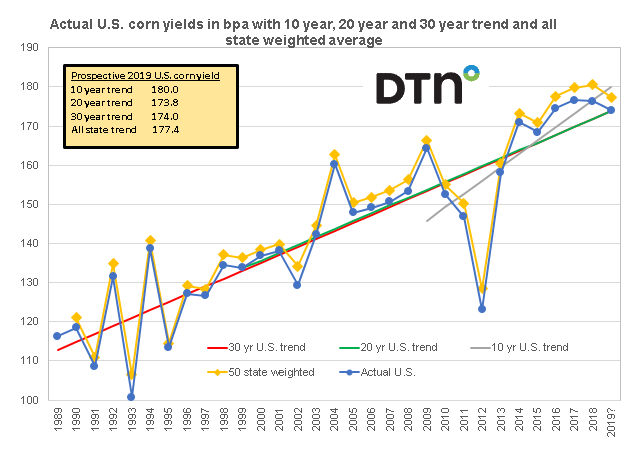
The accompanying graphic looks at the 10, 20 and 30-year trend and projects what each of them would be for this year.
As noted in the box these are 180.0, 173.8 and 174.0 bushels per acre (bpa).
We also calculated the actual all-state weighted yield from 1990 to 2018 using actual state yields multiplied by that states percent of national production and summed up each of the figures to arrive at a weighted state average for the U.S. yield.
The ten-year forecasted trend is highest since U.S. yields since 2009 have increased at an average annual rate of 3.42 bpa as the U.S. has set a number of record corn yields in recent seasons.
The 20 and 30-year trends are much lower at 2.01 and 2.04 bpa increase per year respectively.
The projected all-state weighted average yield for 2019 at 177.4 bpa is second highest as using that methodology yields have increased by an average of 2.09 bpa since 1990
(KLM)
© Copyright 2019 DTN/The Progressive Farmer. All rights reserved.
Comments
To comment, please Log In or Join our Community .