

Fundamentally Speaking
Global Stocks-to-Use Ratios

The USDA released a slew of reports on Friday January 12 and other than a reduction in both the 2017 U.S. soybean yield and production, most of the other figures were bearishly construed.
With the 2017 data out of the way, the markets can now focus attention on this coming year with the key factors, at least right now, centered on what South American row crop production will be, what mix of crops will U.S. farmers plant for the coming season and what will happen with U.S. grain (and also meat and dairy exports) if the Trump administration pulls out of the North American Free Trade Agreement (NAFTA) which, according to both Mexican and Canadian negotiators, appears increasingly likely.
P[L1] D[0x0] M[300x250] OOP[F] ADUNIT[] T[]
The fact remains however that any changes of a significant rally without any crop shortfall in a major producing region of the globe appears fleeting given immense world stockpiles of key commodities, resulting in a high tolerance for any yield adversity for the coming growing season.
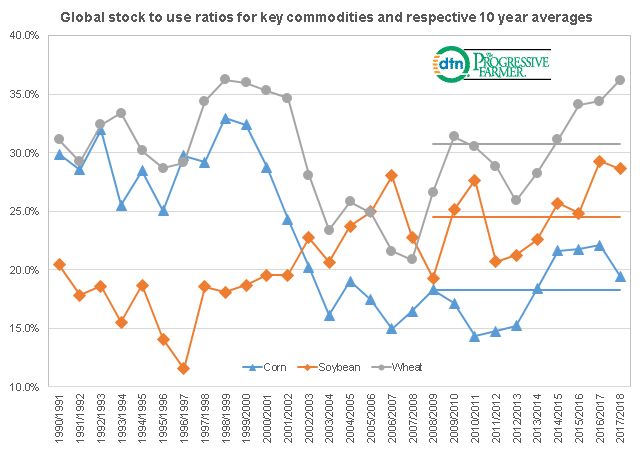
This chart shows the world stock to use ratios for the three major crops of corn, soybeans and wheat.
For wheat, the latest WASDE report featured higher output, lower trade and a slightly reduced level of stocks but at 36.2% the 2017/18 stock to use ratio ties 1998/99 for the highest world wheat stocks-to-use ratio perhaps ever and is 5.4% above the 30.7% ten year average.
For soybeans, slightly higher production than the USDA had estimated in December, along with a slightly lower crush rate, resulted in a slight hike in ending stocks which at 98.57 million metric tons are the highest ever with the stocks-to-use ratio at 28.6%, slightly below the year ago 29.2% but still the second highest ever and 4.1% above its's ten year average.
For corn, steady production estimates combined with lower feed demand resulted in a 2.50 mln tonne increase in ending stocks but that is still a sizable 22.2 mln tonnes below the prior year, resulting in a stocks-to-use ratio of 19.5%, the lowest in four seasons.
That is still 1.2% above the ten-year average of 18.3% and though the smallest differential between its respective 10 year average, the stock and stocks-to-use ratio in the U.S. are so burdensome that even in corn the chance of any significant price appreciation appears muted at this time.
(KA)
Comments
To comment, please Log In or Join our Community .