

Fundamentally Speaking
10, 25 and 40-year Corn Yield Trends
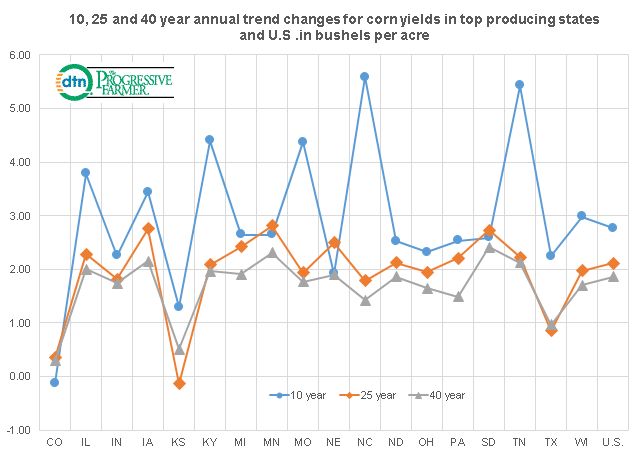
Since the 2012 drought, the U.S. has seen a nice string of impressive national corn yields with all-time highs being set in three of the past four seasons including back-to-back records this year and last.
In light of that, this graphic shows the ten, 25 and 40-year annual trend changes for corn yields in the top 18 producing states and the U.S. as these figures are the slopes of the linear regression line for each of those time periods.
For the most recent period, which is 10 years, shows NC and TN with the strongest yield growth over the past ten years, in excess of 5 bushels per acre (bpa) annually on a trend basis followed up by KS and MO over a 4 bpa increase per year.
P[L1] D[0x0] M[300x250] OOP[F] ADUNIT[] T[]
For NC, the sharp advance may have been due to the trend period starting with a well below trend yield but for the other three that was not the case.
The 40-year trend tends to smooth out the year to year variability in yields and besides TN, the other states that have averaged at least a 2.00 bpa increase in corn yields annually over the 40-year period has been IA, MN and SD.
These three Upper Midwest states have seen yields increase based on more favorable weather conditions such as cooler temperatures and the increased plant population density as compared to other states.
Another interesting observation is despite increase corn plantings in the Plains states, Colorado's ten-year trend is actually negative as is the 20-year trend in Kansas.
We also note that given the trend yield increases in corn, the 10-year annual increase should be greater than the 25-year, which in turn is greater than the 40-year.
This is seen nationally with corn yields averaging a 2.76 bpa increase per year over the past ten years, a 2.11 bpa increase over the past 25 years and a 1.86 bpa increase over the past 40 years, but only 12 of the 18 top producing states follow this pattern.
(KA)
© Copyright 2018 DTN/The Progressive Farmer. All rights reserved.

Comments
To comment, please Log In or Join our Community .