

Fundamentally Speaking
July-November Soybean Spread Seasonality
The July-November soybean spread is one of the more traded spreads for the agricultural futures markets as this is the most common old crop (July) vs. new crop (November) contracts.
This spread tends to weaken, July gets cheaper vs. November when stocks are adequate to ample and strengthens July gains on November when supplies are tight and stocks are low.
In recent years, July soybean futures have held a healthy premium over November as strong export demand to China had kept U.S. soybean inventories and the stock to use ratio at very low levels.
P[L1] D[0x0] M[300x250] OOP[F] ADUNIT[] T[]
This year however, based on record South American production that is supplanting our sales to China and the second highest U.S. production ever, the 2017/18 soybean stocks-to-use ratio is pegged at 10.0%, the loftiest level in 11 seasons.
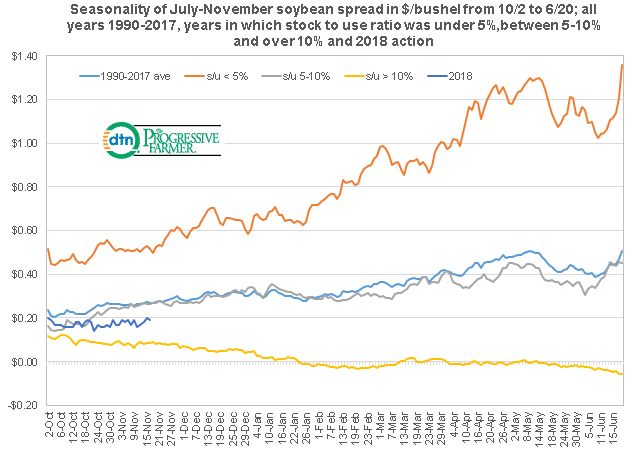
This graphic shows the seasonality of the July-November soybean spread for the years 1990-2017 from the period October 2nd to June 20th along with those years in which the final stocks-to-use ratio was under 5%, those years when it was between 5-10% and years when it was above 10%.
The graphic shows that the spread usually strengthens over time, especially when stocks are tight and less than 5% of consumption.
However when the stocks-to-use ratio is at 10% or higher, which is the case this year, there is a seasonal weakening of the spread all the way into the end of June.
The current 20-cent premium may be a sale especially if one feels that the USDA will pare this year's export figure due to a lagging sales pace and push final year inventories and the stock to use ratio even higher in subsequent WASDE reports.
(KA)
© Copyright 2017 DTN/The Progressive Farmer. All rights reserved.

Comments
To comment, please Log In or Join our Community .