

Fundamentally Speaking
History of Corn Yield Changes

The USDA has pared the 2016 U.S. corn yield estimate twice in a row from the August projection at 175.1 bushels per acre (bpa) down to 174.4 bpa in the September report and again last week in the October crop report to 173.4 bpa.
Expectations are that another reduction will be seen in the November report though a review of past years when yields are lowered in both the September and October reports suggests this is not the case.
P[L1] D[0x0] M[300x250] OOP[F] ADUNIT[] T[]
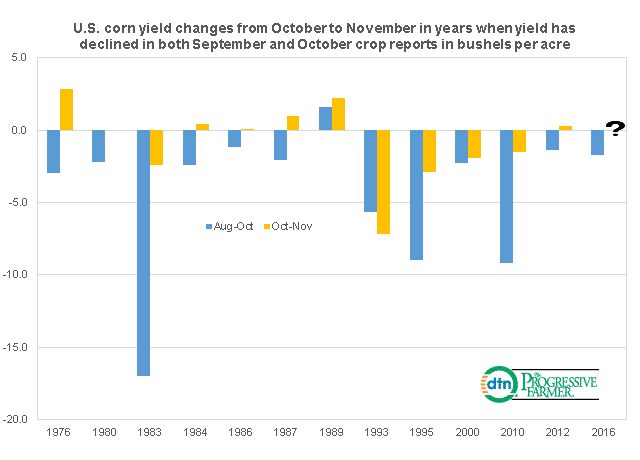
This graphic shows the years since 1974 when the USDA lowered its U.S. corn yield in both the September and October reports showing the net bushel yield change from the August to the October report and then the yield change from the October to November crop production report.
Including this year there actually has been 13 times since 1974 when the USDA lowered its corn yield in both the September and October reports with the average decline from the August to the October projection down 4.3 bushels per acre with an additional 0.8 bpa decline seen in the November report on average.
Yet of the 12 October to November changes, six declined again in the November report but six actually reversed and had a higher November than October yield.
In fact, it is more likely that yields will rise in November when the August to October aggregate yield has been modest such as this year (-1.7 bpa).
Further declines in November are more likely when the USDA has reduced yields significantly from August to October such as in 1983, 1993, 1995 and 2010.
(KA)
© Copyright 2016 DTN/The Progressive Farmer. All rights reserved.
Comments
To comment, please Log In or Join our Community .