

Fundamentally Speaking
Shift in U.S. Corn Acreage

The USDA will release their 2016 Prospective Plantings report on March 31st about a month after their Ag Outlook Conference where the department's initial, albeit tentative, forecast of corn plantings at 90.0 million acres is about two million higher than last year's actual seedings.
Though corn prices are the lowest in years, with fall delivered prices being above average variable costs it is thought that at least for this year domestic corn acreage will be maintained if not expanded.
We are actually more interested in the regional change in acreage that has occurred over the past 15 years with higher corn prices resulting in more seedings being done outside the traditional Midwest producing area.
P[L1] D[0x0] M[300x250] OOP[F] ADUNIT[] T[]
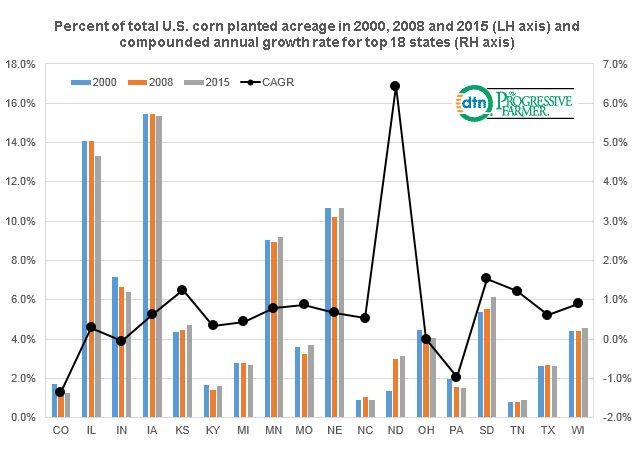
This chart shows the percent of total U.S. corn planted acreage in 2000, 2008 and 2015 for the top 18 corn producing states on the left hand axis and each states 15 year compounded annual growth rate of corn acreage.
It is interesting to note that corn acreage in some key states has declined as a percent of total U.S. acreage even though their aggregate level of seedings has increased.
In 15 years IL has gone from 14.1% to 13.3% of U.S. planted area, IN 7.2% to 6.4%, IA 15.5% to 15.3% and OH from 4.5% to 4.0%.
On the other hand the sharp increase in corn values over the past decade has increased seedings in other areas of the country, especially more northern and western locales displacing some crops that used to be grown such as wheat, sorghum and various minor oilseeds.
For instance KS has gone from 4.3% of U.S. planted area to 4.7%, ND from 1.4% to 3.1% and SD from 5.4% to 6.1%.
In a prior post we had made mention of the sharp increase in North Dakota's corn acreage with this graphic show a stunning 6.4% compounded annual growth rate since 2000.
(KA)
© Copyright 2016 DTN/The Progressive Farmer. All rights reserved.
Comments
To comment, please Log In or Join our Community .