
Fundamentally Speaking
Falling Soybean Meal/Corn Ratio

In recent years protein prices have been relatively strong compared to energy prices in most feed rations.
Protein prices are usually tracked by soybean meal values while corn serves as the proxy for estimating net energy costs.
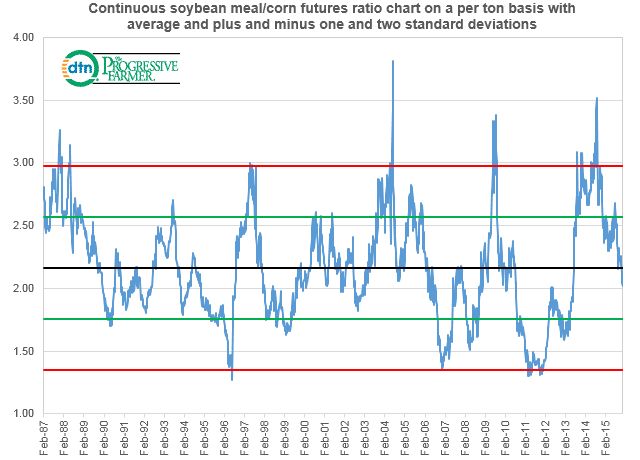
The accompanying graphic is the long-term soybean meal/corn ratio on a per ton basis with the average ratio and the plus and minus one and two standard deviation lines.
This means that the SBM/corn ratio has been between the plus and minus one standard deviation (green) lines 68% of the time and has been between the plus and minus two standard deviation (red) lines 95% of the time.
Fifteen months ago the ratio was at one of its highest points ever due to one of the tightest soybean stock to use ratios in history vs. relatively ample supplies of corn.
Now the situation is reversed with the current soybean stock and stock to use ratios the highest in nine years while crush margins have plummeted based on a drop in soybean meal prices linked to a dramatic slowdown in export demand amid a high valued U.S. dollar and ample product from South America.
Plummeting livestock margins and well above temperatures in the main U.S. feeding areas so far this fall has also weighed on domestic offtake.
As consequence the SBM/corn ratio has fallen below the long-term average of 2.16 and looks headed down to the negative one standard deviation mark of 1.75.
(KA)
P[L1] D[0x0] M[300x250] OOP[F] ADUNIT[] T[]
Comments
To comment, please Log In or Join our Community .