
Editors' Notebook
Gearing Up for 2021 Digital Yield Tour
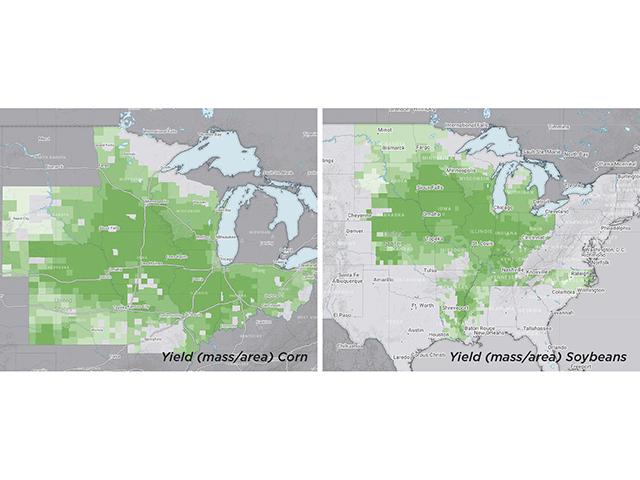
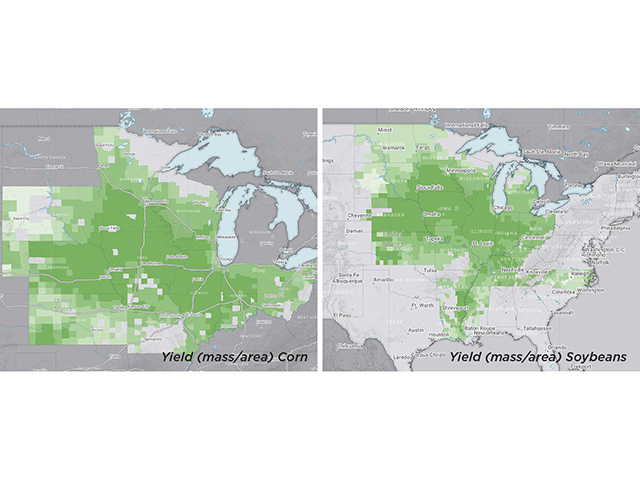
We're excited to start talking about the DTN/Progressive Farmer 2021 Digital Yield Tour, our fourth annual tour powered by Gro Intelligence. This virtual yield tour, which features in-depth analysis from Gro's satellite-imagery-based yield models as well as on-the-ground reporting by the DTN team, will once again give a broad view of crop conditions and yield expectations for the corn and soybean crop across 10 Corn Belt states.
This virtual "tour" starts on Aug. 9.
We're again pleased to partner with Gro Intelligence and feature that company's real-time crop analytical models. Those crop modeling systems are based on a wide array of public and private crop and environmental data: normalized difference vegetation index (NDVI) from NASA satellite imagery, land surface temperature (LST) maps, rainfall including DTN-supplied weather data, USDA crop condition surveys, crop calendars, planted and harvested acreage data from the National Agricultural Statistics Service (NASS), cropland data and U.S. government soil surveys.
P[L1] D[0x0] M[300x250] OOP[F] ADUNIT[] T[]
We'll start with a series of daily multi-state reports Aug. 9-12. That will culminate in the announcement of Gro's national average yield estimate on Aug. 13.
This year's tour once again coincides with the Aug. 12 World Agricultural Supply and Demand Estimates (WASDE) report from USDA. So you'll have a fast comparison of those government yield estimates with results from Gro's modelling efforts.
We continue to hold that this broad, satellite-based view has a key advantage over traditional crop-tour surveys. Where standard tours are based on a random sample of fields that can be covered in a short time frame, satellite imagery is taking in crop and field conditions from every field, in every county, of the states we'll report on. Over the seasons that has allowed us to highlight the real-time effects of events such as the 2020 derecho, account for yield losses during years where prevented planting acres were significant, and observe overall crop conditions as they're evolving.
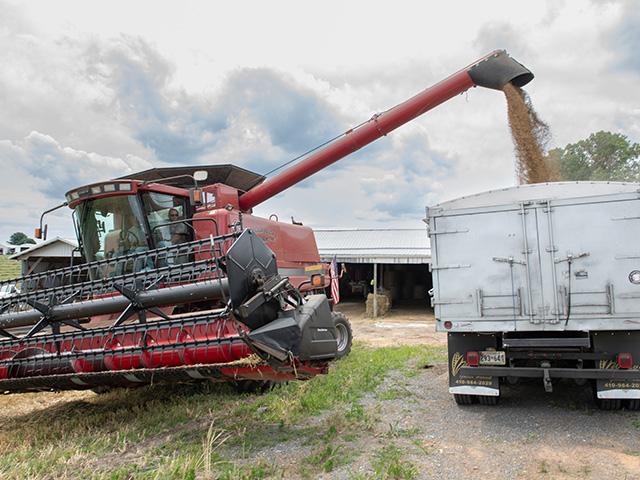
We back all that high-level information up with on-the-ground reporting and discussions with farmers, agronomists and others with direct insights into how the crop is shaping up in their areas.
Watch for a full list of events for the tour in our Top Stories segment on our digital platforms and in the August issue of Progressive Farmer magazine.
Greg Horstmeier can be reached at greg.horstmeier@dtn.com
Follow him on Twitter @greghorstmeier
(c) Copyright 2021 DTN, LLC. All rights reserved.
Comments
To comment, please Log In or Join our Community .