

Canada Markets
Canola Market Response to the Dec. 31 Grains Stocks Report
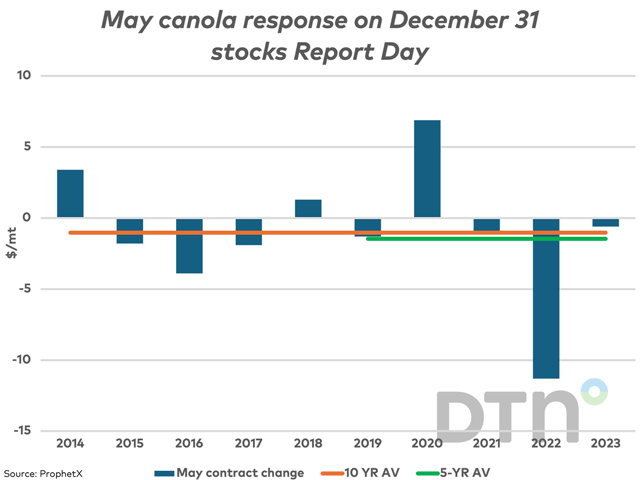
The potential for a surprise when Statistics Canada releases its grain stocks estimates, as of Dec. 31, in early February always exists, although the canola market response on the day of the report during the past 10 years signals that the results of the report were well-anticipated.
During the last 10 years, the early February response of the May contract on the day of the report has ranged from a $11.30/metric ton bearish response or drop in price in 2022 to a $6.90/mt bullish response of increase in price in 2020, as seen on the attached chart.
P[L1] D[0x0] M[300x250] OOP[F] ADUNIT[] T[]
Outside of these two years, the response on the day of the report has ranged from a $3.90/mt drop in price to a $3.40/mt increase in the May contract.
As seen on the chart, the May contract has closed higher in three of the past 10 years, while lower in the other seven years.
On average during the past five years, the drop is a modest $1.46/mt while the 10-year average signals a $1.02/mt drop in price. Recent history would suggest that the chance of a significant surprise is low for canola overall, although past results cannot predict the future.
Cliff Jamieson can be reached at cliff.jamieson@dtn.com.
Follow him on X, formerly known as Twitter, @CliffJamieson.
(c) Copyright 2024 DTN, LLC. All rights reserved.

Comments
To comment, please Log In or Join our Community .